Delta Hedging an OTM Call (aka The "Pin")
This content explaining the 4775 Pin was first posted as a tweet on December 26, 2023 before market open (8:26 AM). That day SPX closed at 4774.75.
Todays largest 0dte (0 day-to-expiration) gamma exposure on SPX is on the 4775 calls.
We can see this in the image below:
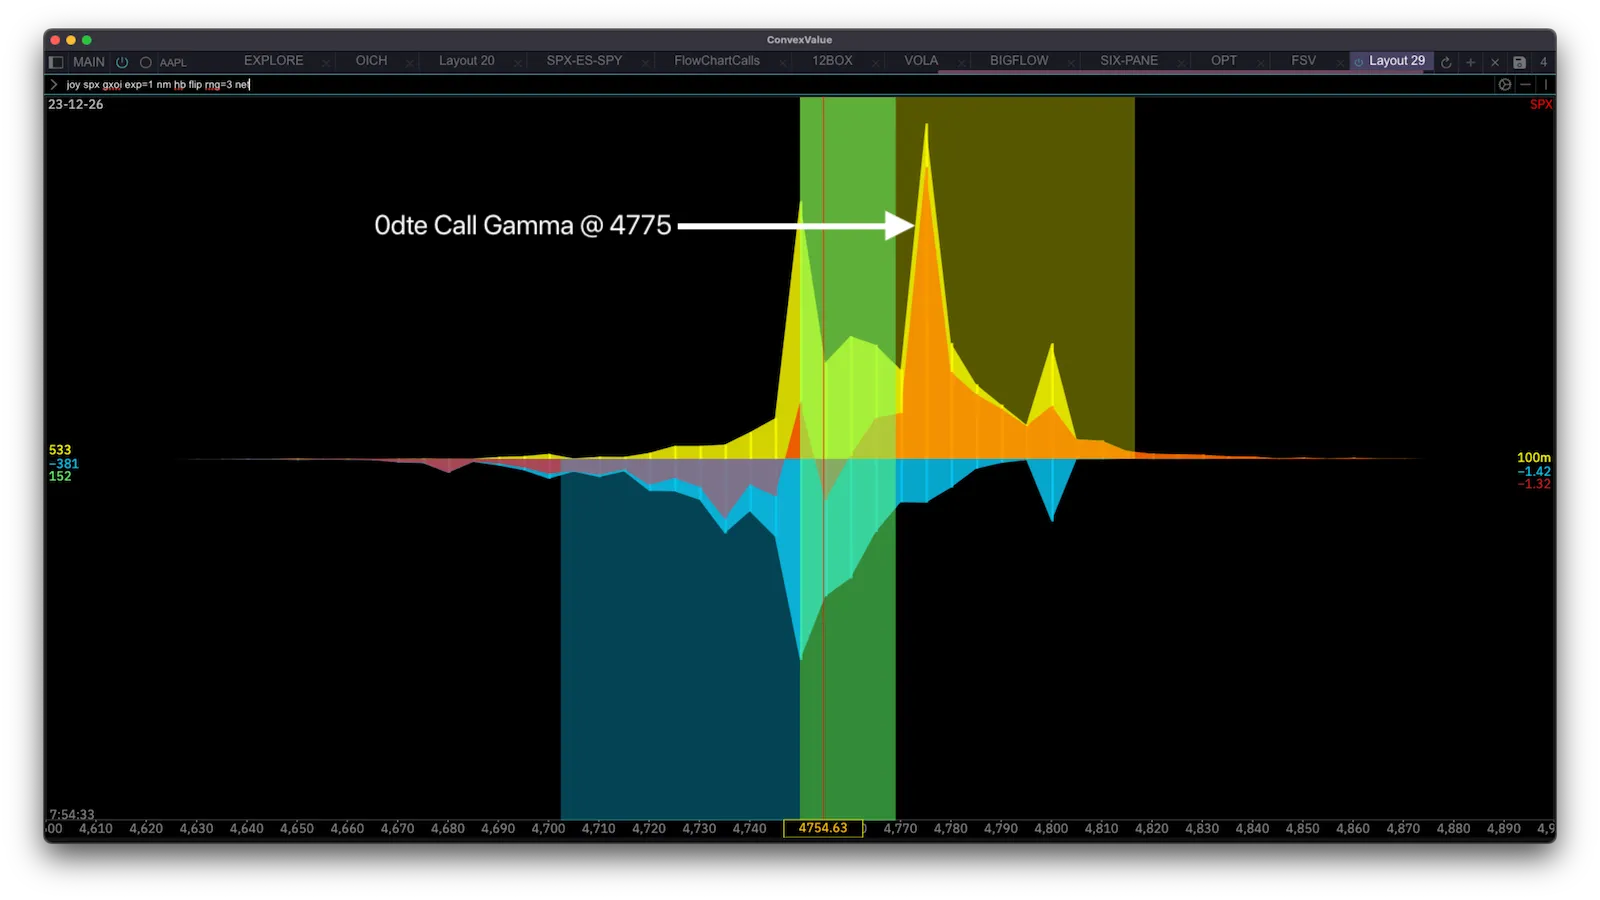
joy spx gxoi exp=1 nm hb flip rng=3 netThe image shows strikes on the x-axis, and “gxoi” (gamma exposure, or how much gamma there is on each strike based on open interest). As always, calls are yellow and puts are blue. The red spikes are “net” of calls and puts. Current spot price (4754.63) is shown with the red line on the center along with its corresponding label at the bottom.
It is showing only the Dec 26, 2023 expiration. The large horizontal bars display the call, put, and net aggregates for the expiration.
We first notice three big call spikes (yellow spikes) at 4750, 4775, 4800. We also notice two big put spikes (blue spikes) at 4750 and 4800. The red spikes are the net of call and puts.
The 4750 and 4800 spikes both have large Call and Put concentrations, and we can see how they are largely neutralized by noting the size of the red spikes.
The 4775 spike, however, has a significantly larger Call concentration than Put concentration, which we can see via the red spike. It is the largest red spike.
The nature of gamma is that is concentrates at-the-money (near spot price). It looks like this:
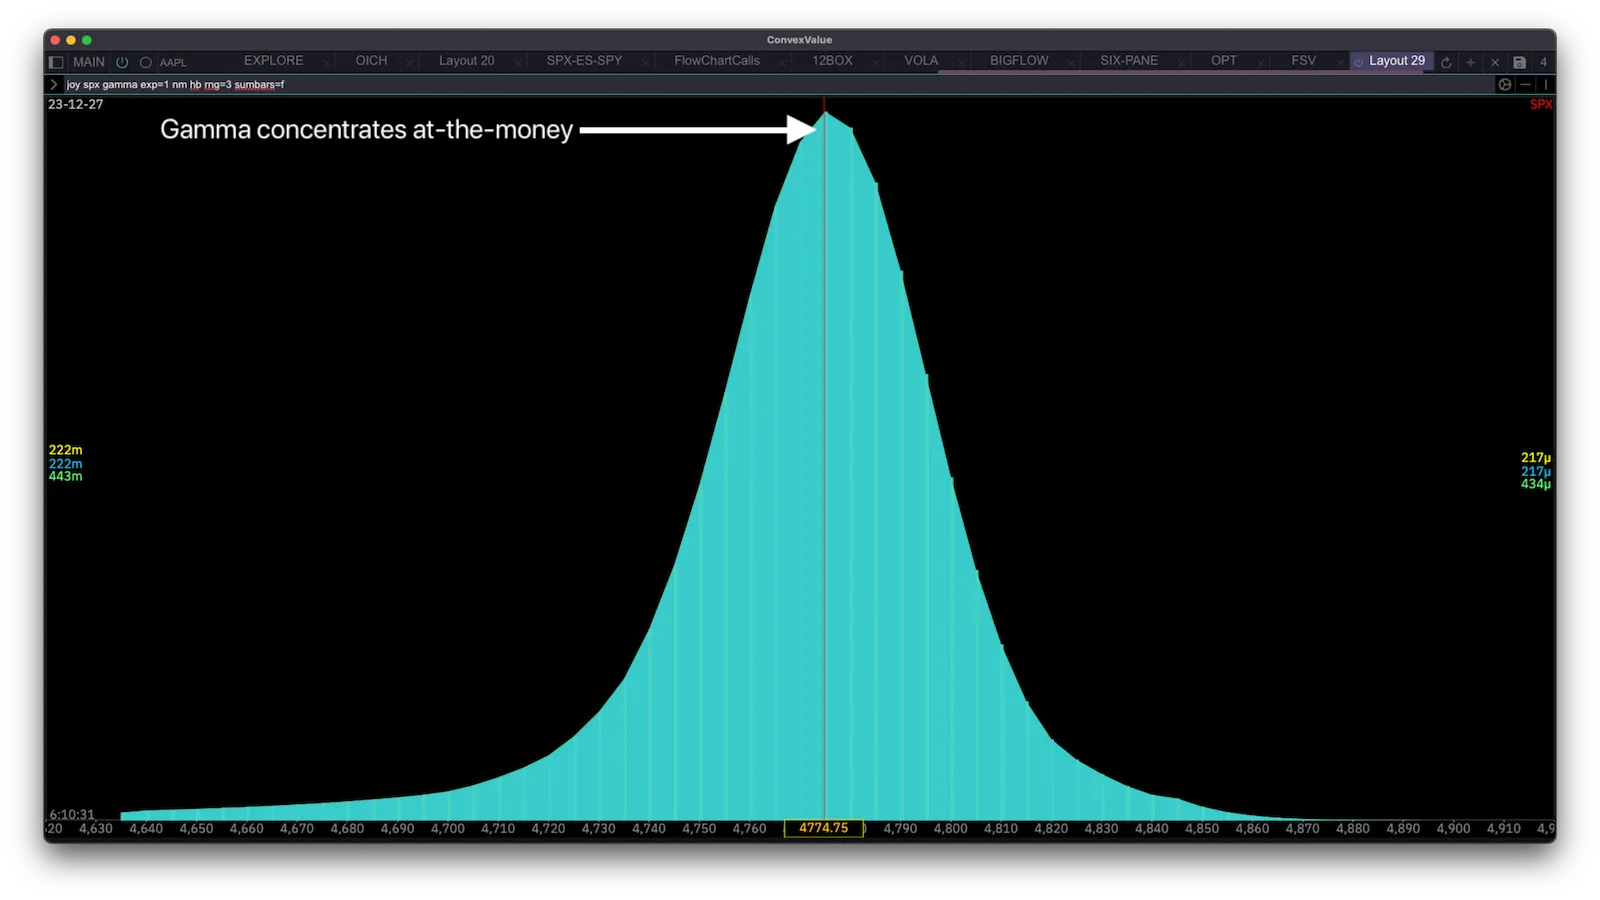
joy spx gamma exp=1 nm hb rng=3 sumbars=fAs we can see, gamma is like a mountain that is weaker on the wings and concentrates towards the spot price.
That is what makes the 4775 spike on the gxoi chart so special. A non-special gxoi graphic would have the largest spike near-the-money - aligned with the fact that gamma is strongest at-the-money.
But today, on SPX, the Call Open Interest on 4775 is so large that in spite of being 20 points away from spot price, it still has the largest gamma concentration.
This matters because it can serve as a “pin” or “magnet” for price. Let’s see how that works.
The Gamma Pin
Although there are a bunch of other options in play that can cancel all this out, we can imagine a hypothetical scenario to understand the effect of the “pin”.
Imagine an SPX dealer holding long solely 1 of these 0dte 4775 OTM calls:
An OTM Call has a delta between 0 and 0.5, the actual delta depends on time to expiration and implied volatility.
This specific call has delta of 0.27.
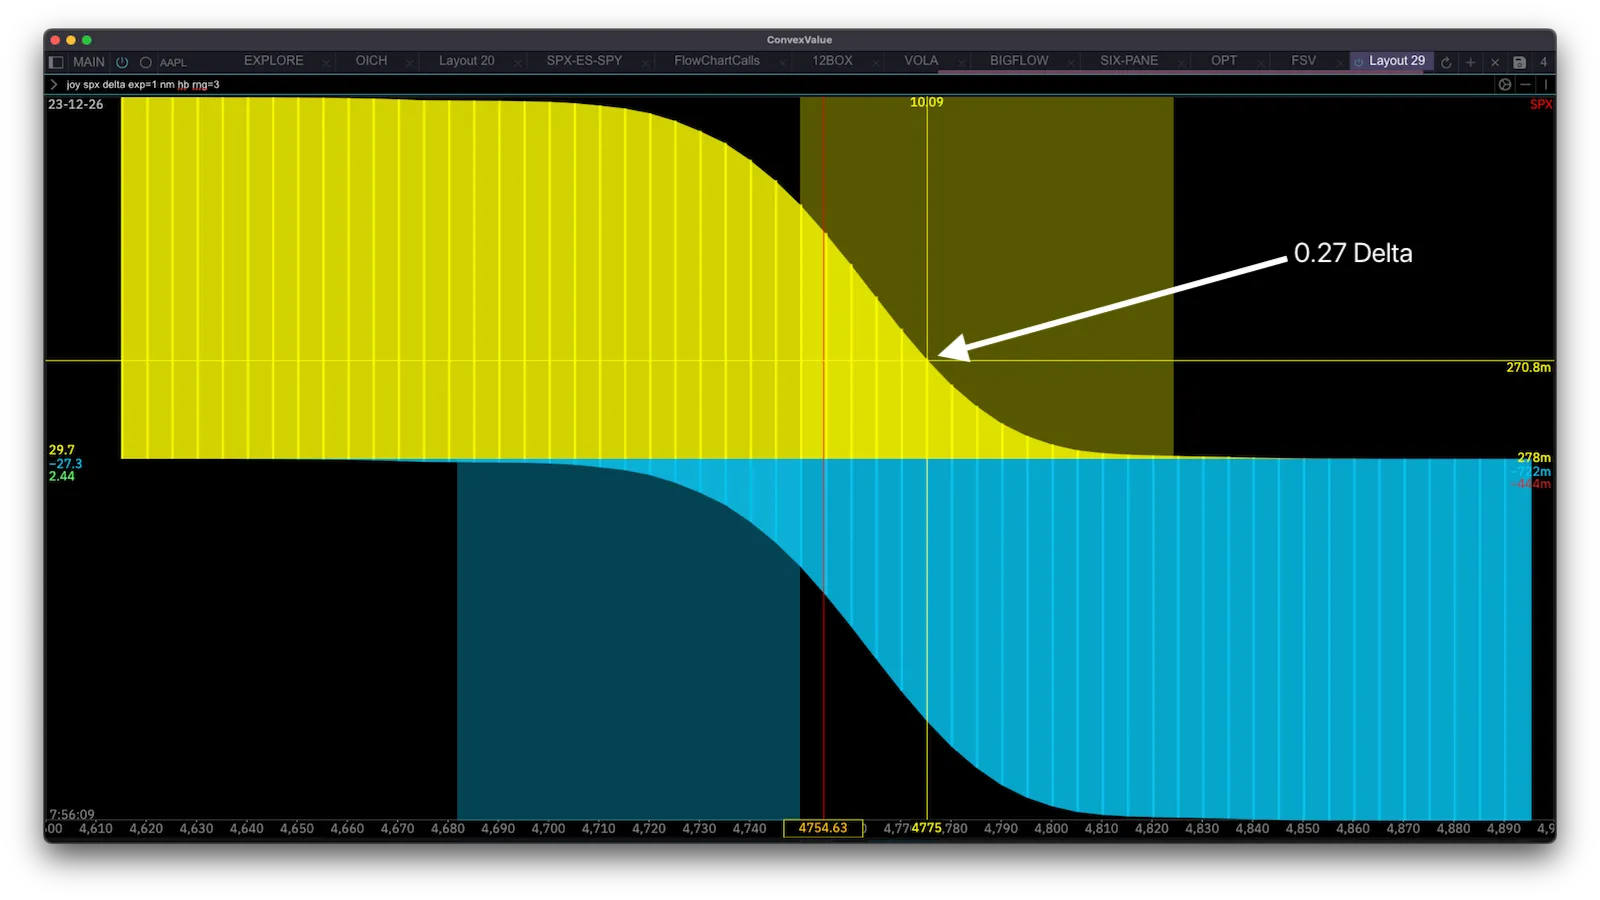
joy spx delta exp=1 nm hb rng=3If the dealer is long this call they have a Delta Exposure of +27, meaning they need to be short 27 shares to be hedged.
There are two important vectors that affect delta that we will cover here: price and time. They will both change delta and thus change how dealers have to hedge this position.
Delta changing with price
If SPX starts falling, the delta of that call gets closer to 0. Why? Intuitively - using the delta-as-probability framework - the probability of this call expiring in the money falls if price falls.
Currently, with SPX at 4754.63, the priced probability of expiring in the money for this call is 0.27, that is: 27%. If SPX falls and thus moves away from the strike, the probability lowers. Given it is 0dte and every minute counts - this is fast.
As delta falls from 0.27 towards 0, they need to reduce their hedge, this means buying back shares.
For example, if delta falls to 0.20 their delta exposure on those calls becomes +20. But they had -27 shares to cancel it out! This means they need to buy back 7 of the shares they are short to have a matching -20 hedge.
If Price Falls => Buy to Hedge
If Price rises, delta grows towards 1. Using the delta-as-probability framework - it is because the probability of those calls expiring in-the-money grows as price gets closer to it. This makes those -27 shares they have as hedge not enough to hedge the calls. For example, if delta rises to 0.40 (and thus their delta exposure is 40), then they need to add 13 short shares to their hedge to have -40 delta on the shares.
If Price Rises => Sell to Hedge
Summary: if price falls dealers have the buy to hedge, if price rises dealers have to sell to hedge. You might be thinking - where is the Pin? This doesn’t much sound like “pinning” to 4775, it sounds like price suppression, pinning to spot price. And you are right, but now we cover the second big effect - time.
Delta changing with time
Given that these Calls are OTM 0dte, theta is acting very rapidly.
Every minute that passes that they remain OTM, the probability of them expiring in-the-money falls to 0 - that is, delta falls towards 0.
Since delta is getting smaller it means the -27 shares they are short are too much, they need to reduce their hedge by buying back shares, pushing price up.
If OTM and time passes => Buy to Hedge
If price goes up beyond 4775, then theta instead of pushing towards 0, pushes towards 1. This is because they are then already in-the-money so their chances of remaining in-the-money get closer and closer to 100% the closer we reach expiration.
With delta growing to 1, they need to increase their hedge - sell more shares.
If ITM and time passes => Sell to Hedge
Now imagine if you hold these calls, what is your ideal scenario?
Your ideal scenario is for price to go up at exactly the same rate as delta is decaying due to time.
So if delta is 0.27, an hour passes decaying that delta to 0.20. It would be awesome for you if price had also risen enough to keep delta at 0.27 - then you don’t have to change your hedge at all!
If this plays out perfectly for you, price goes up at the exact same rate as delta decay all the way to 4775 at EOD.
You don’t want it to go past that though, because then you have to hedge. Which you do by selling - pushing price down.
So in an ideal world for the delta-hedging holder of this call, SPX price drifts upwards to the 4775 strike price and gets pinned to it.
Post Mortem
On this day, SPX behaved precisely as was described in this post. Understanding that on a given day there is a likelihood of behavior such as this is the definition of having an edge. So knowing how to interpret charts like this is a valuable tool in a traders’ arsenal.