SPX IV and Vanna
Below we see the current Implied Volatility Term Structure for SPX in yellow. The other colored lines are Implied Volatility Term Structure historical watermarks - depicting how the term structure looked before. This allows us to compare the current state of volatility with the past.
We can see that it has been steadily declining for over a month.
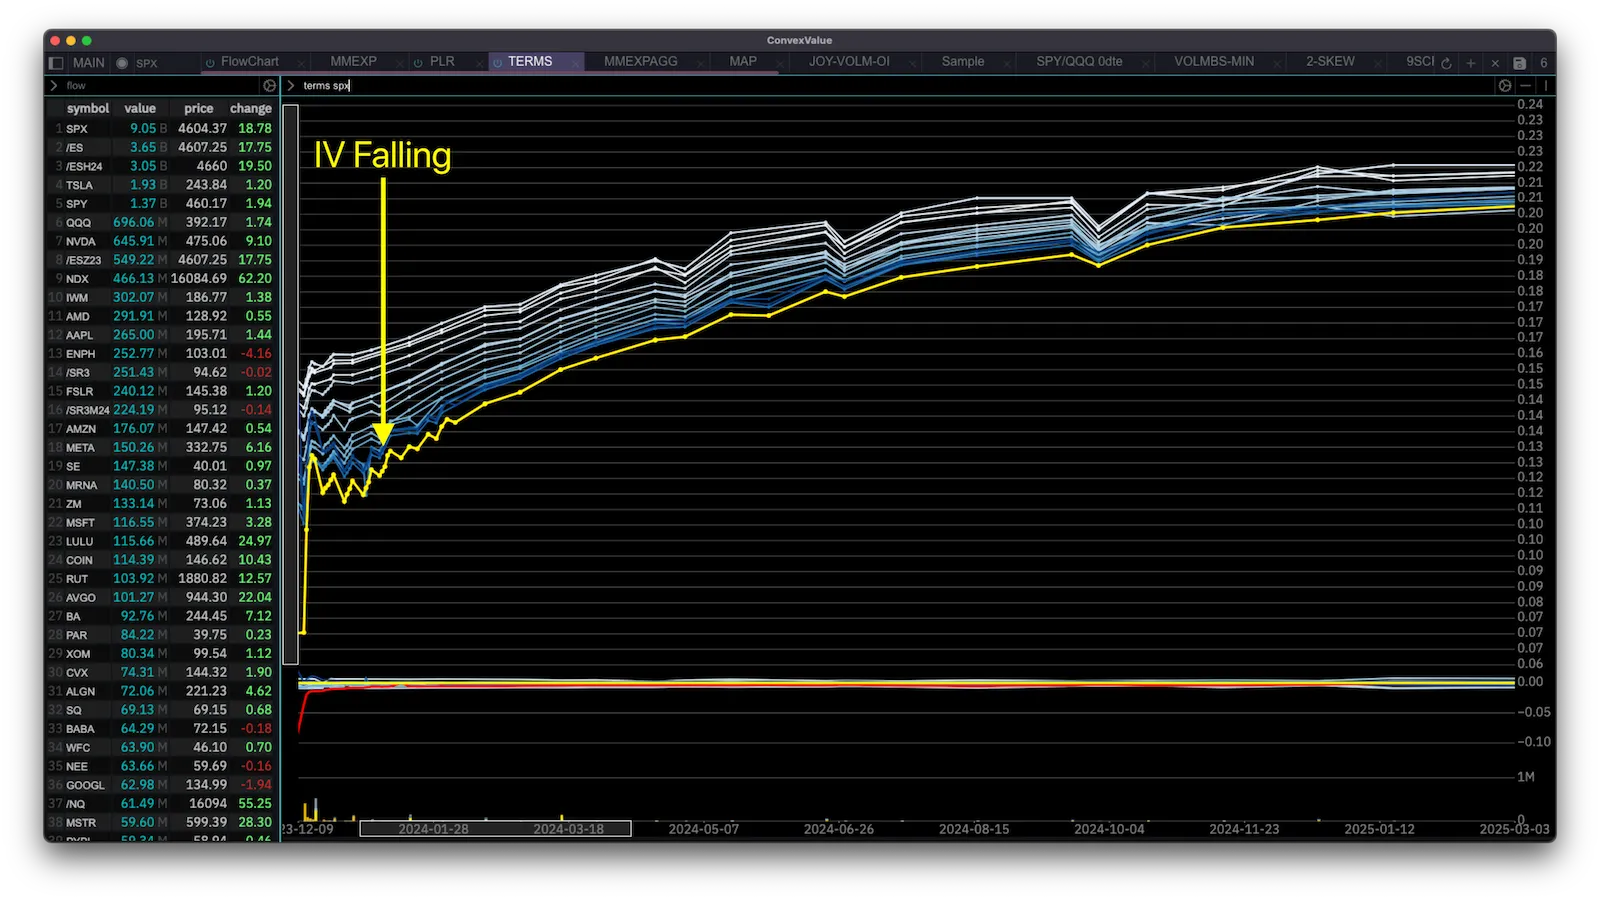
terms SPXThis has implications for market makers.
We can look at the overall Vanna exposure for SPX for December 2023 through January 2024 by charting vannaxoi:
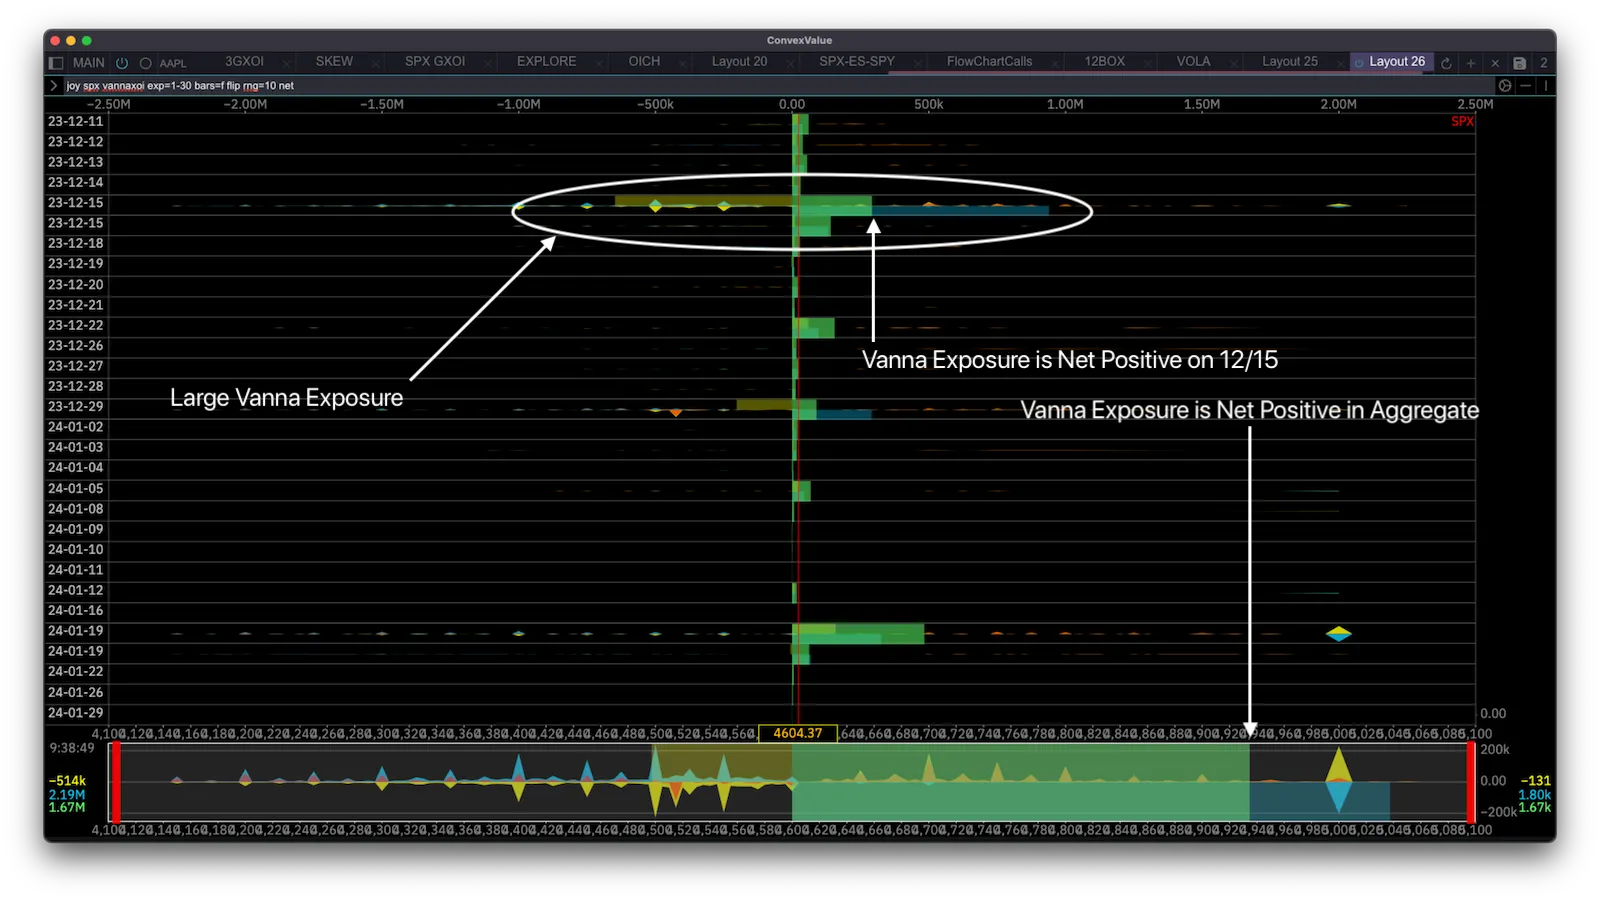
joy spx vannaxoi exp=1-30 bars=f flip rng=10 netWe can see that the 12/15 Quarterly Expiration has the largest concentration of Vanna. We can also see that the aggregate net Vanna exposure (displayed in the horizontal bars) both for 12/15 and for all expirations is positive.
- Call Vanna is shown in yellow, and it has an aggregate negative effect (yellow bar to the left).
- Put Vanna is shown in blue, and it has an aggregate positive effect (blue bar to the right).
- Net Vanna (sum of call and put Vanna) has a positive effect due to Put Vanna being larger than Call Vanna, it is displayed in green with the horizontal bar to the right.
We have seen SPX rally for over a month which leads to a virtuous cycle when Vanna exposure has these conditions:
Price Rallies -> volatility drops -> dealer delta drops -> dealers buy to hedge -> price rallies.
You’ll notice that net Vanna is positive because Put Vanna (positive) is larger than Call Vanna (negative), but is this always the case? Can we count on the bullish flows all through January 2024?
It is not always the case - and to explain why let’s take a step back to Vanna by first principles:
Vanna
Let’s plot vanna for any one expiration on SPX to understand its shape:
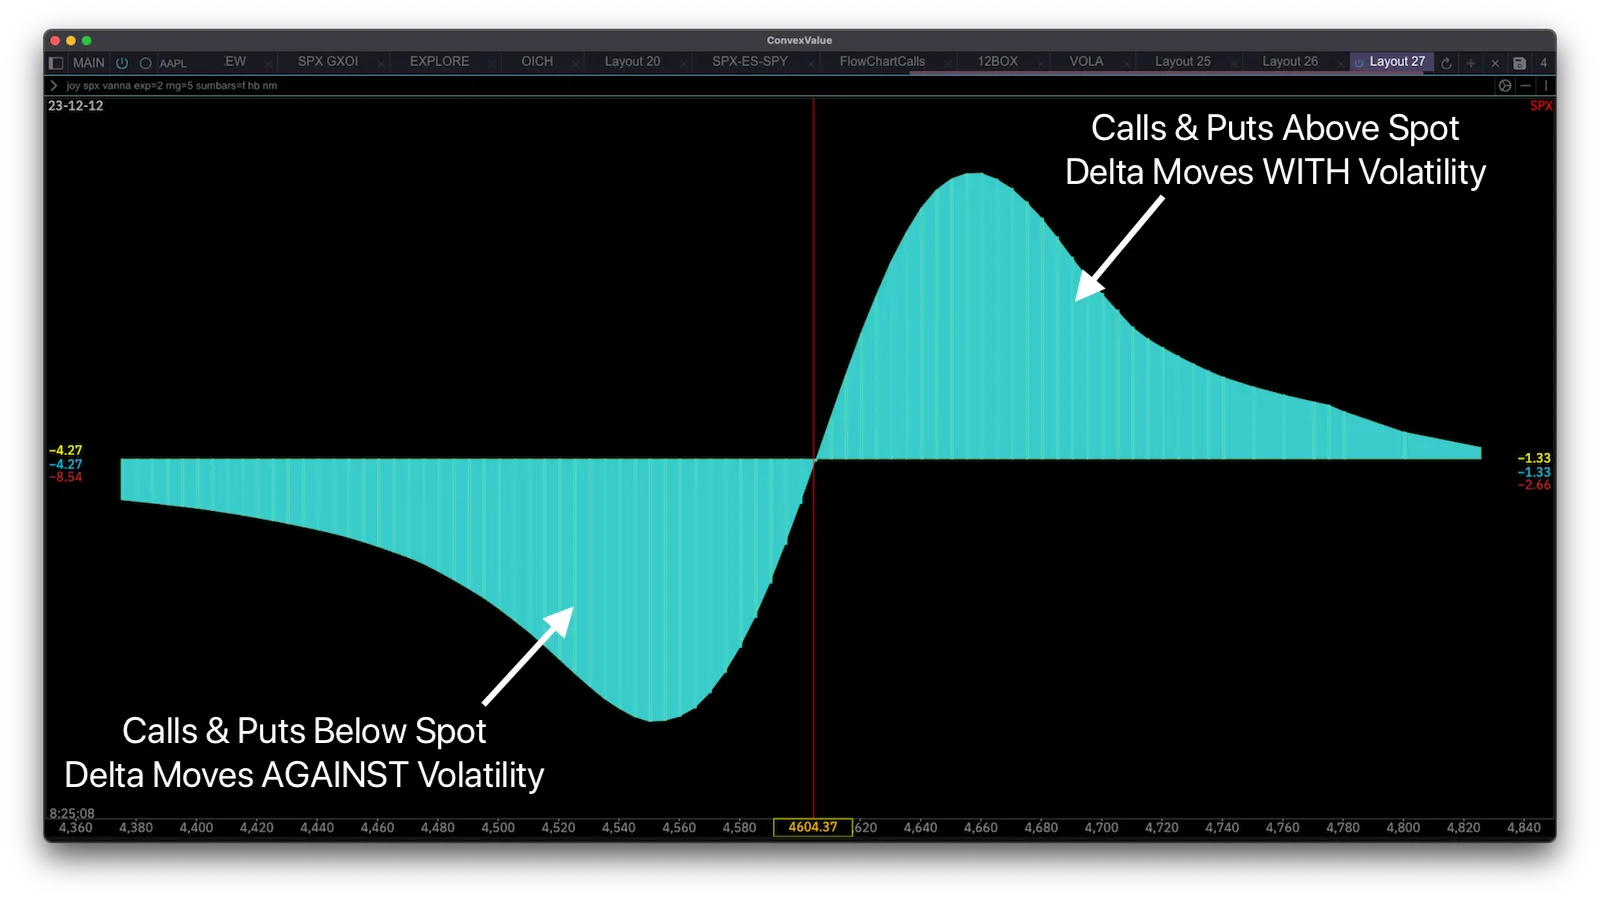
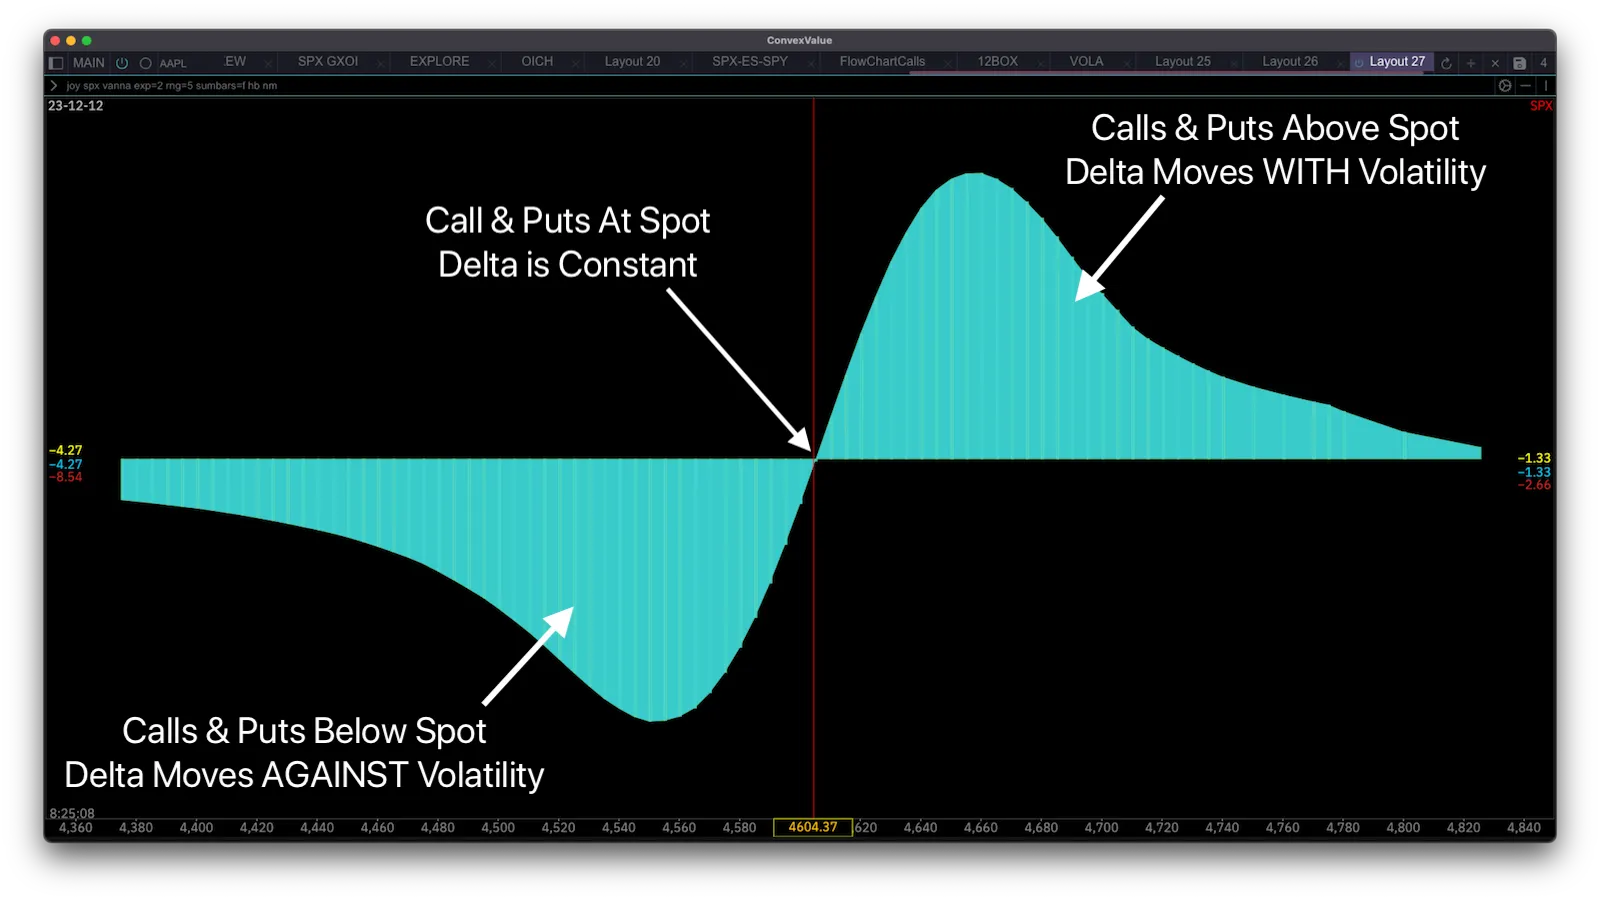
joy spx vanna exp=2 rng=5 sumbars=f hb nmWhat we see is that Calls and Puts with strikes above spot price have a positive Vanna - i.e they move in the same direction as implied volatility. This means that when implied volatility goes up, delta also goes up.
On the other hand, Calls and Puts with strikes below spot price have a negative Vanna - i.e they move in the opposite direction of implied volatility. When implied volatility goes up, the delta of these options goes down, and when implied volatility goes down, the delta goes up.
To intuitively understand why this is the case we can use our framework of “Delta as Probability” - where we think of delta as the probability of an option expiring in-the-money.
A quick recap of the Delta as Probability framework is shown here by charting the delta of both calls (yellow) and puts (blue) on the y-axis and strike price on the x-axis:
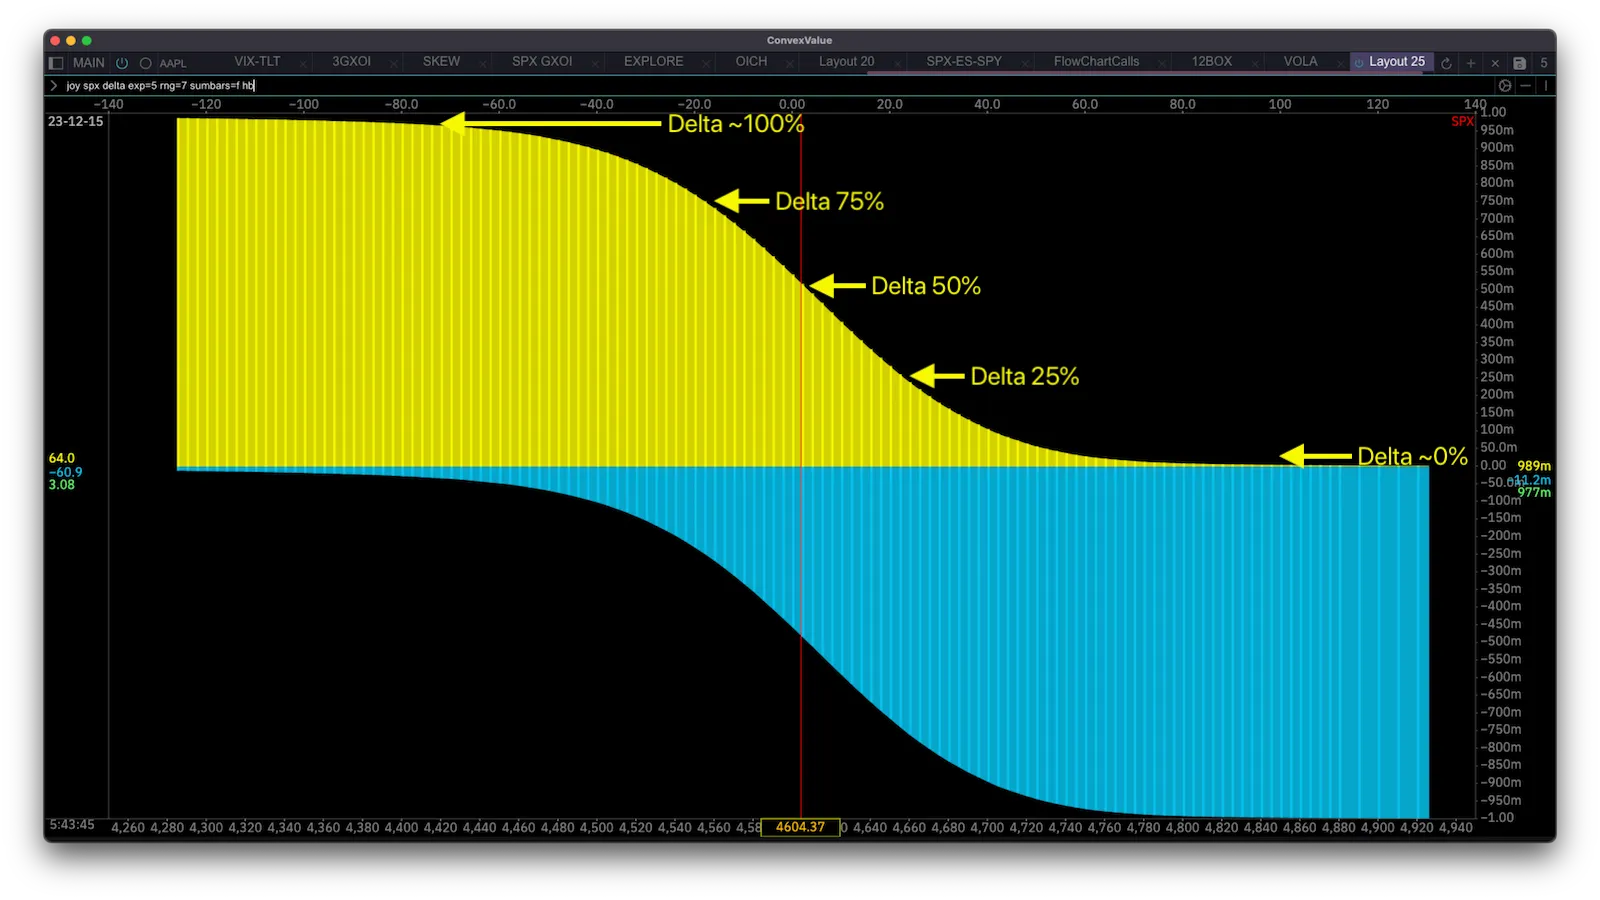
joy spx delta exp=5 rng=7 sumbars=f hbWhat you see is that options that are at-the-money have a delta of 50% - they have a 50/50 chance of expiring in-the-money because the underlying stock has a 50/50 chance of going up vs down.
Options that are in-the-money have a delta of 50% to 100%. The deeper they are in-the-money the closer their delta is to 100% because the deeper they are in-the-money the more certain it is that they will expire in-the-money.
Options that are out-of-the-money have a delta of 50% to 0%. The further they are out-of-the-money, the less likely they are to expire in-the-money which is reflected by a delta going towards 0.
This framework helps us intuitively to understand the effect of changes in volatility to delta - i.e Vanna. Let’s analyze them one by one.
Out-of-the-money Calls
We now know that out-of-the-money Calls have a Delta of 0.5 to 0. What happens to their delta when implied volatility rises?
Let’s take a hypothetical Call Strike 110 when underlying price is at 100. Let’s say it has a delta of 0.25 - i.e a 25% chance of expiring in-the-money.
If implied volatility rises, it means the underlying is expected to move more, so the chance of this call expiring in-the-money is now higher, its delta is higher.
If implied volatility lowers it means the underlying is expected to move less. Hypothetically, if implied volatility lowers all the way to 0 it means the stock will not move at all, thus the probability of that call falls to 0, its delta falls.
We conclude that the Delta of out-of-the-money calls moves in the same direction as implied volatility.
In-the-money Calls
Let’s now analyze in-the-money calls. Intuitively, their effect should be the opposite.
When volatility rises, something that used to be a sure thing is no longer a sure thing.
For example: let’s say at in-the-money call with strike 50 with underlying price at 100 has a delta of 0.90 - meaning its probability of expiring in-the-money is 90%. On the the reasons this could be the case is because implied volatility is such that it is highly unlikely for the stock to fall from 100 to 50 before that call expires.
Now, imagine implied volatility suddenly rises dramatically, and the stock is now expected to move much more that before. Now the probability of that call expiring in the money is not so certain - it might be 80% instead of 99%. When implied volatility rises, the Delta of in-the-money options falls.
Similarly, if implied volatility falls and the stock is expected to move much less, then the probability of that call expiring in-the-money rises.
From this we see that the Delta of in-the-money options moves in the opposite direction as implied volatility.
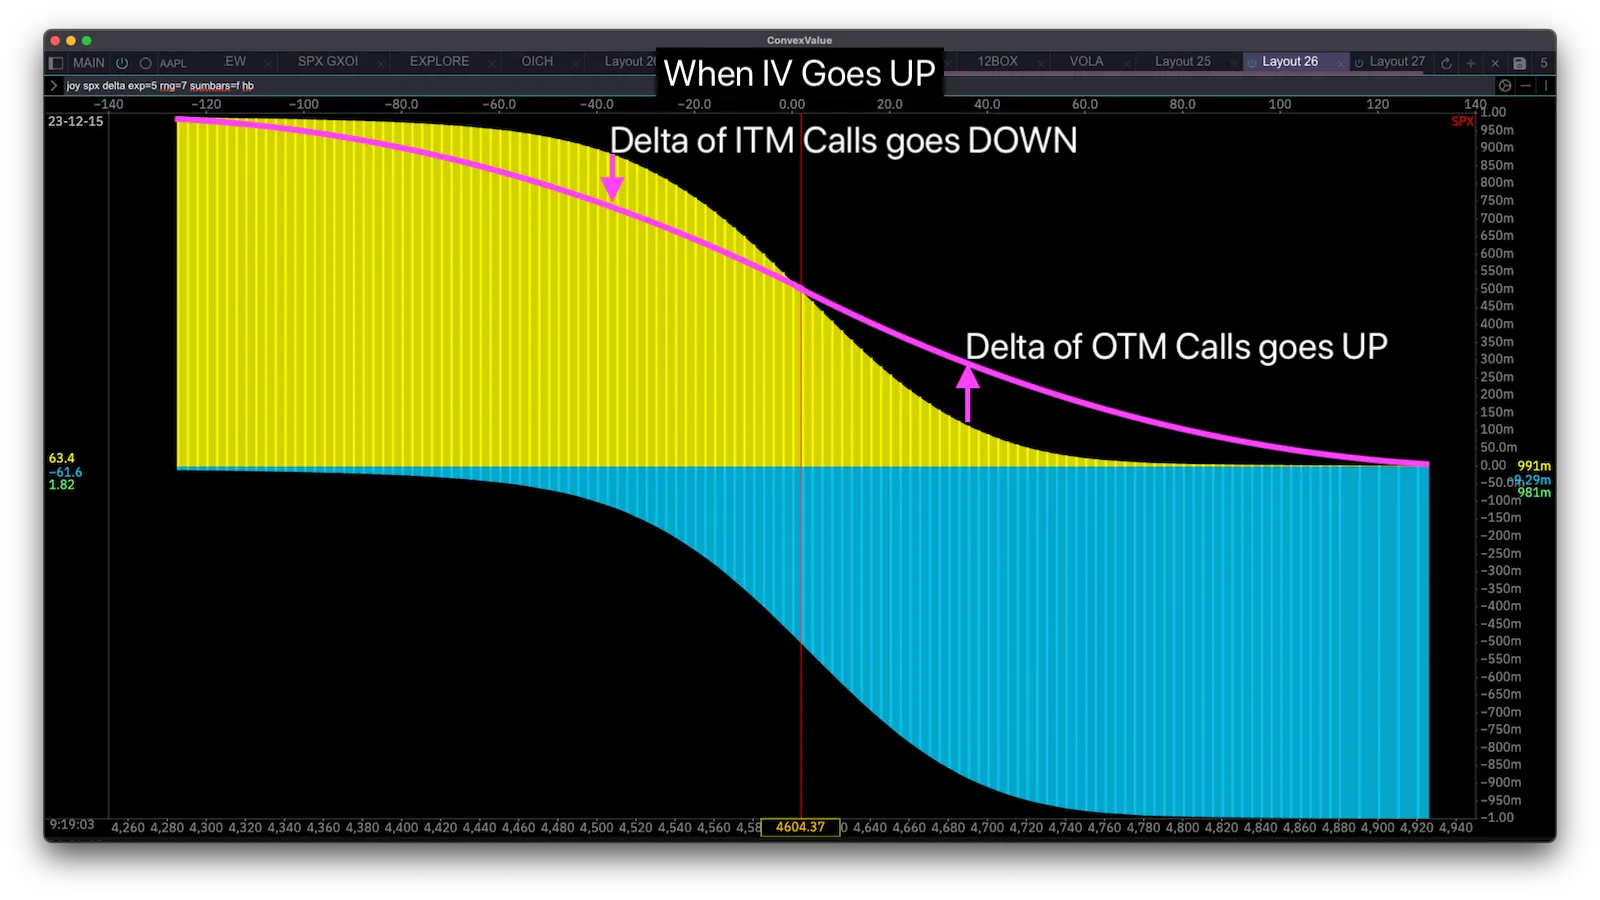
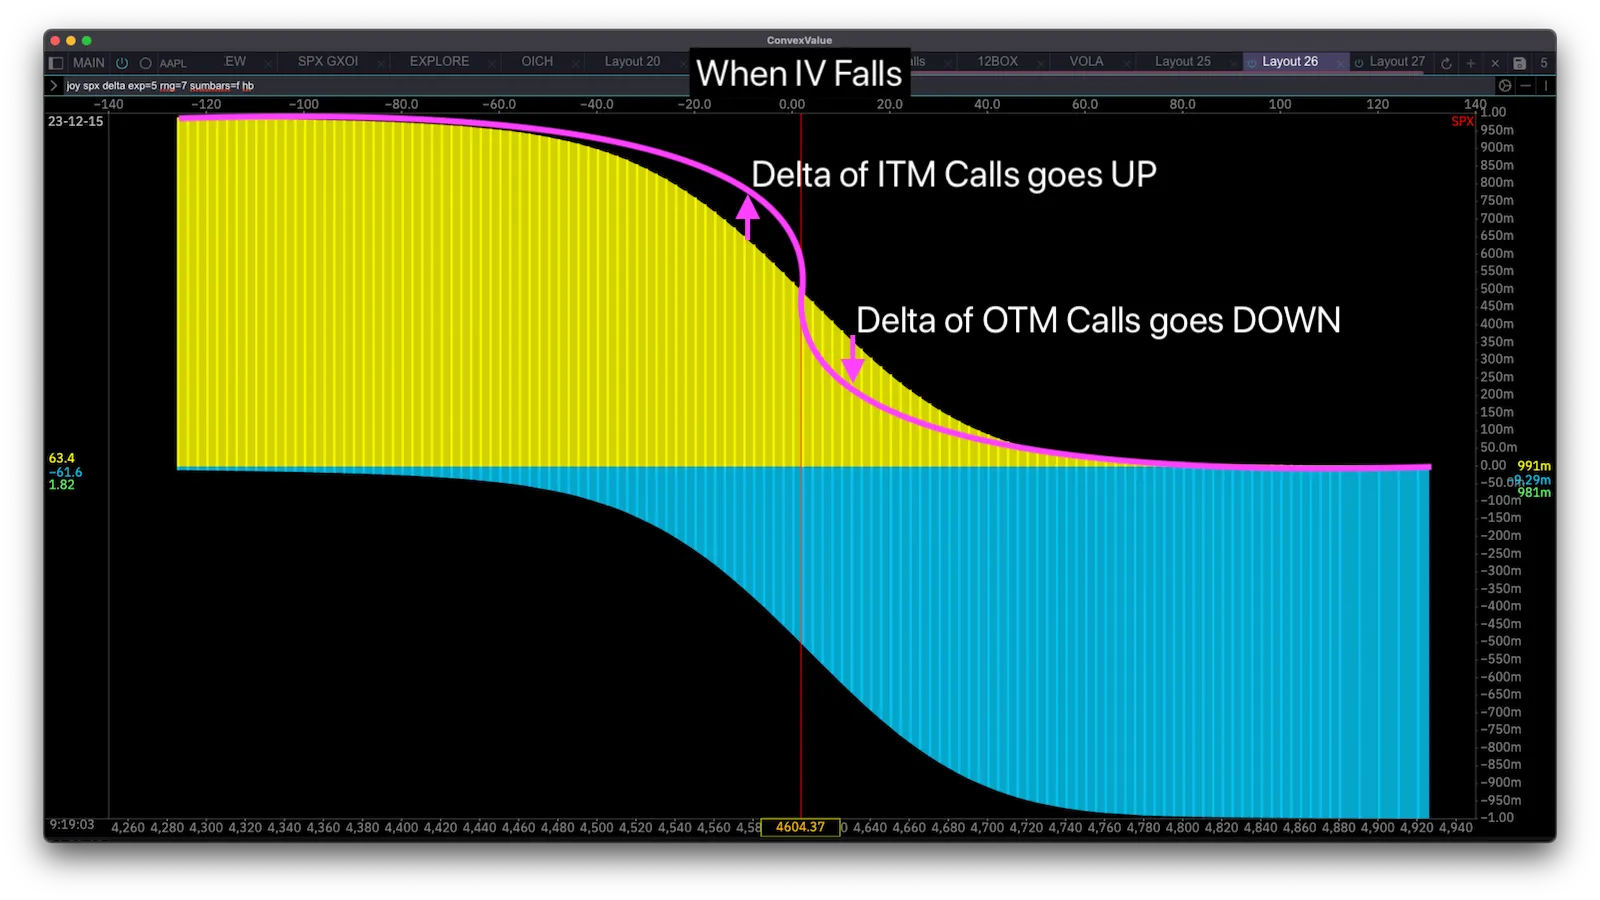
From these two examples we can now picture how the shape of delta flattens out when implied volatility rises (taking away probability from in-the-money calls and giving it to out-of-the-money calls) and contracts when implied volatility falls:
Out-of-the-money Puts
When we understand the shape of delta for Calls and how it flattens and contracts when implied volatility rises or falls - we can apply the same logic to Puts.
For Puts the same principles apply but the direction of delta is opposite.
Puts always have a negative delta (the price of puts goes in the opposite direction of stock price), but if we think about delta as probability a negative probability doesn’t make much sense, does it?
When thinking about Delta as probability, we ignore the negative sign. So a put with a delta of -0.25 simply has a probability of expiring in-the-money of 25%. Simple as that.
However, when thinking about Delta as a risk exposure - the negative sign matters greatly.
Let’s bring up our Vanna chart again:
joy spx vanna exp=2 rng=5 sumbars=f hb nmAnd let’s analyze what happens with out-of-the-money Puts when implied volatility changes.
An out-of-the-money Put is one where strike is below spot price, and it has a delta between 0 and -0.5, i.e a probability of expiring in-the-money of 0 to 50%.
When implied volatility rises, we apply the same logic that we used to analyze out-of-the-money calls to arrive at the conclusion that probability rises. For example, the probability of expiring in-the-money of a Put might rise from 25% to 30%.
However, if we translate this to Put Deltas it maps out from -0.25 to -0.3. So although probability rises, the raw delta number becomes more negative.
Thus, when implied volatility rises, out-of-the-money put delta becomes more negative - i.e out-of-the-money Put Delta moves in the opposite direction of implied volatility.
In-the-money Puts
We apply the same logic of in-the-money Calls to in-the-money Puts:
When implied volatility rises, the probability of in-the-money Calls and Puts falls.
For example, a Put that was nearly certain to expire in-the-money and had a Delta of -0.99 (99%) might loose some probability when implied volatility rises and end up with a probability of 90%. However, in put deltas which are negative, that is a move from -0.99 to -0.9 - i.e delta goes up!
Thus, when implied volatility rises, in-the-money put delta becomes more positive - i.e in-the-money Put Delta moves in the same direction as implied volatility.
Summary
Let’s recap what we’ve covered:
| Calls & Puts | Vanna | Explanation |
|---|---|---|
| Above Spot | Positive | Delta Moves WITH Implied Volatility |
| Below Spot | Negative | Delta Moves AGAINST Implied Volatility |
| At Spot | Zero | Delta stays at 0.5 |
Now that we understand the theory, let’s apply it it to the current SPX landscape.
SPX IV and Vanna
Let’s look at the SPX Vanna exposure landscape spread out across expirations that we saw in the beginning:
joy spx Vannaxoi exp=1-30 bars=f flip rng=10 netAs we said pointed out, there is concentration in 12/15 expiration and overall positive Vanna. We also mentioned that with net positive Vanna, there is a virtuous bullish cycle that causes drops in implied volatility to be met with market makers buying to hedge which provides bullish flows which can in turn continue pushing price up.
We were also wondering how this landscape can change. In other words - where is that Vanna located that is providing this landscape?
To do that we will aggregate Vanna exposure by strikes instead of separating by expirations - and we see the following:
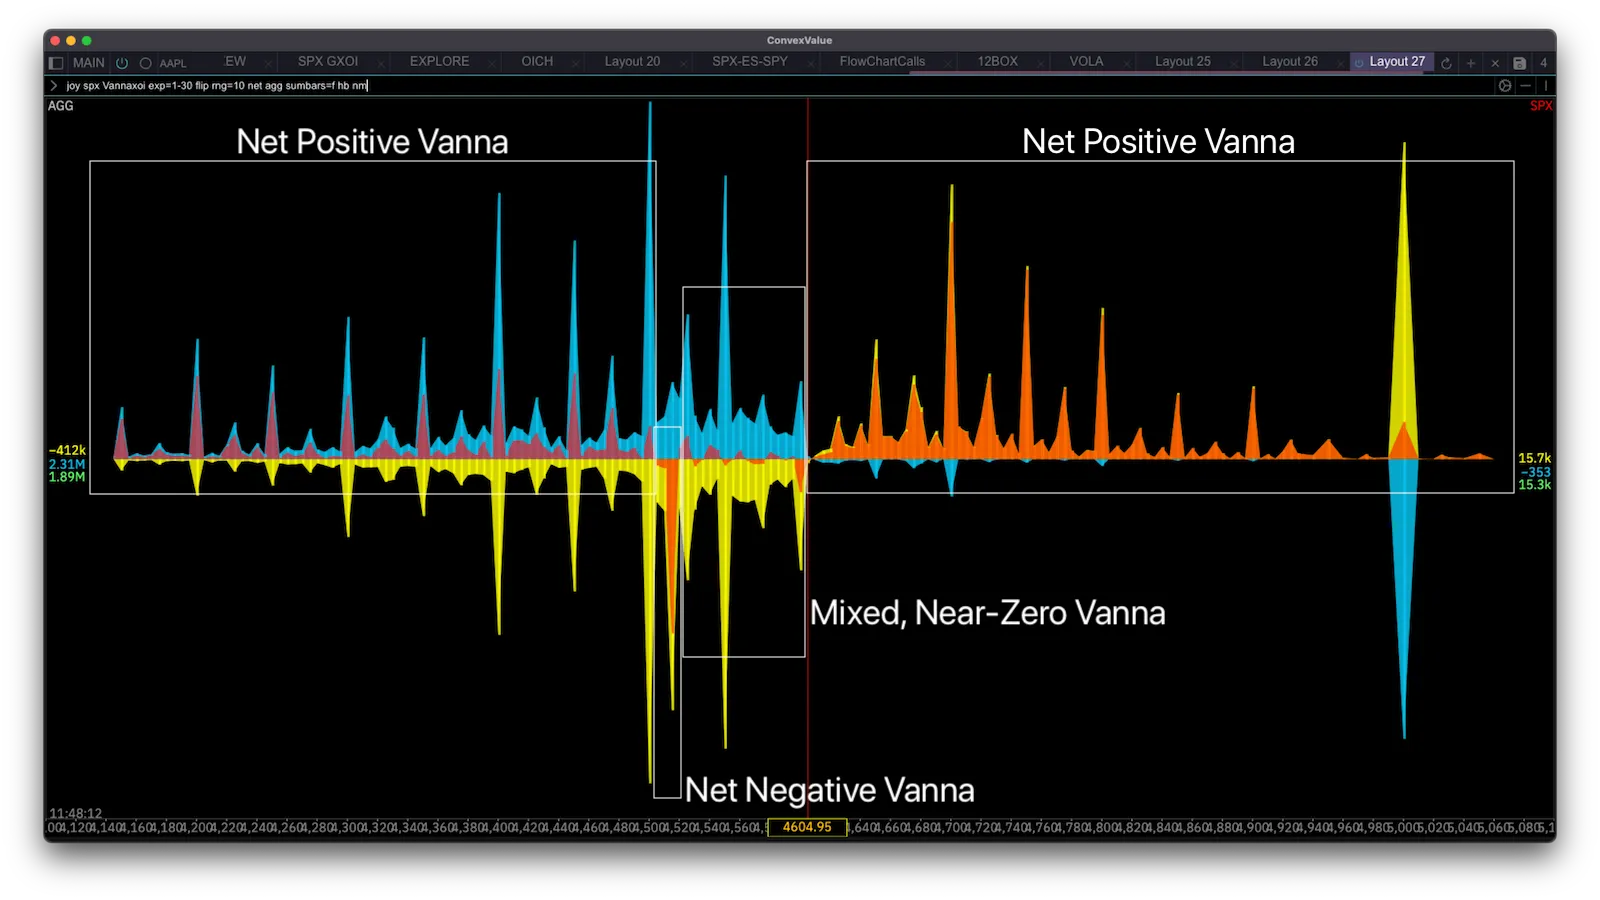
joy spx vannaxoi exp=1-30 flip rng=10 net agg sumbars=f hb nmThe blue spikes depict Put Vanna, the yellow spikes depict Call Vanna, and the red spikes depict net Vanna exposure.
We can see that above spot there is largely positive Vanna exposure dominated by Call Open Interest. We see this because there are large yellow spikes (Calls), almost no blue spikes (puts), and the net (red) spikes are all pointing upwards.
Right below spot price there is a mixed area, some strikes have larger Put Vanna, some have larger Call Vanna, so we see the net Vanna (red) alternating between slightly positive and slightly negative.
We know the Vanna effects now. But how to interpret it moving forward?
Think of spot price as a slider that can slide left or right. Whenever it slides in one direction, it will flip the net Vanna to the opposite direction.
We know Vanna is entirely positive above spot price from the picture above. When price begins sliding upwards, it will transform all that net positive Vanna into net negative Vanna (remember, out-of-the money calls move with delta and in-the-money calls move against delta ).
From this we deduce that the Vanna effect will weaken as we rally. Although there is the virtuous cycle which provides a self-reinforcing buying pressure, the strength of this cycle will weaken as we rally.
If we fall - between 4600 and 4500 where there is near-zero net Vanna - little should happen.
If we fall below 4500, that net positive Vanna below 4500 will turn into net negative Vanna.
In a price fall which usually is accompanied by rising implied volatility - if there is positive Vanna then Deltas will rise with volatility, meaning the virtuous cycle turns to vicious cycle because with the rising deltas market makers have to sell to hedge which further pushes price down.
So in a price fall we want Vanna to be neutralized. This neutralization will begin happening below 4500.
Conclusion
- Positive Vanna plus Market Rally leads to a bullish virtuous cycle.