First Dashboard
Once you download The ConvexValue Terminal and open it - it will look something like this:
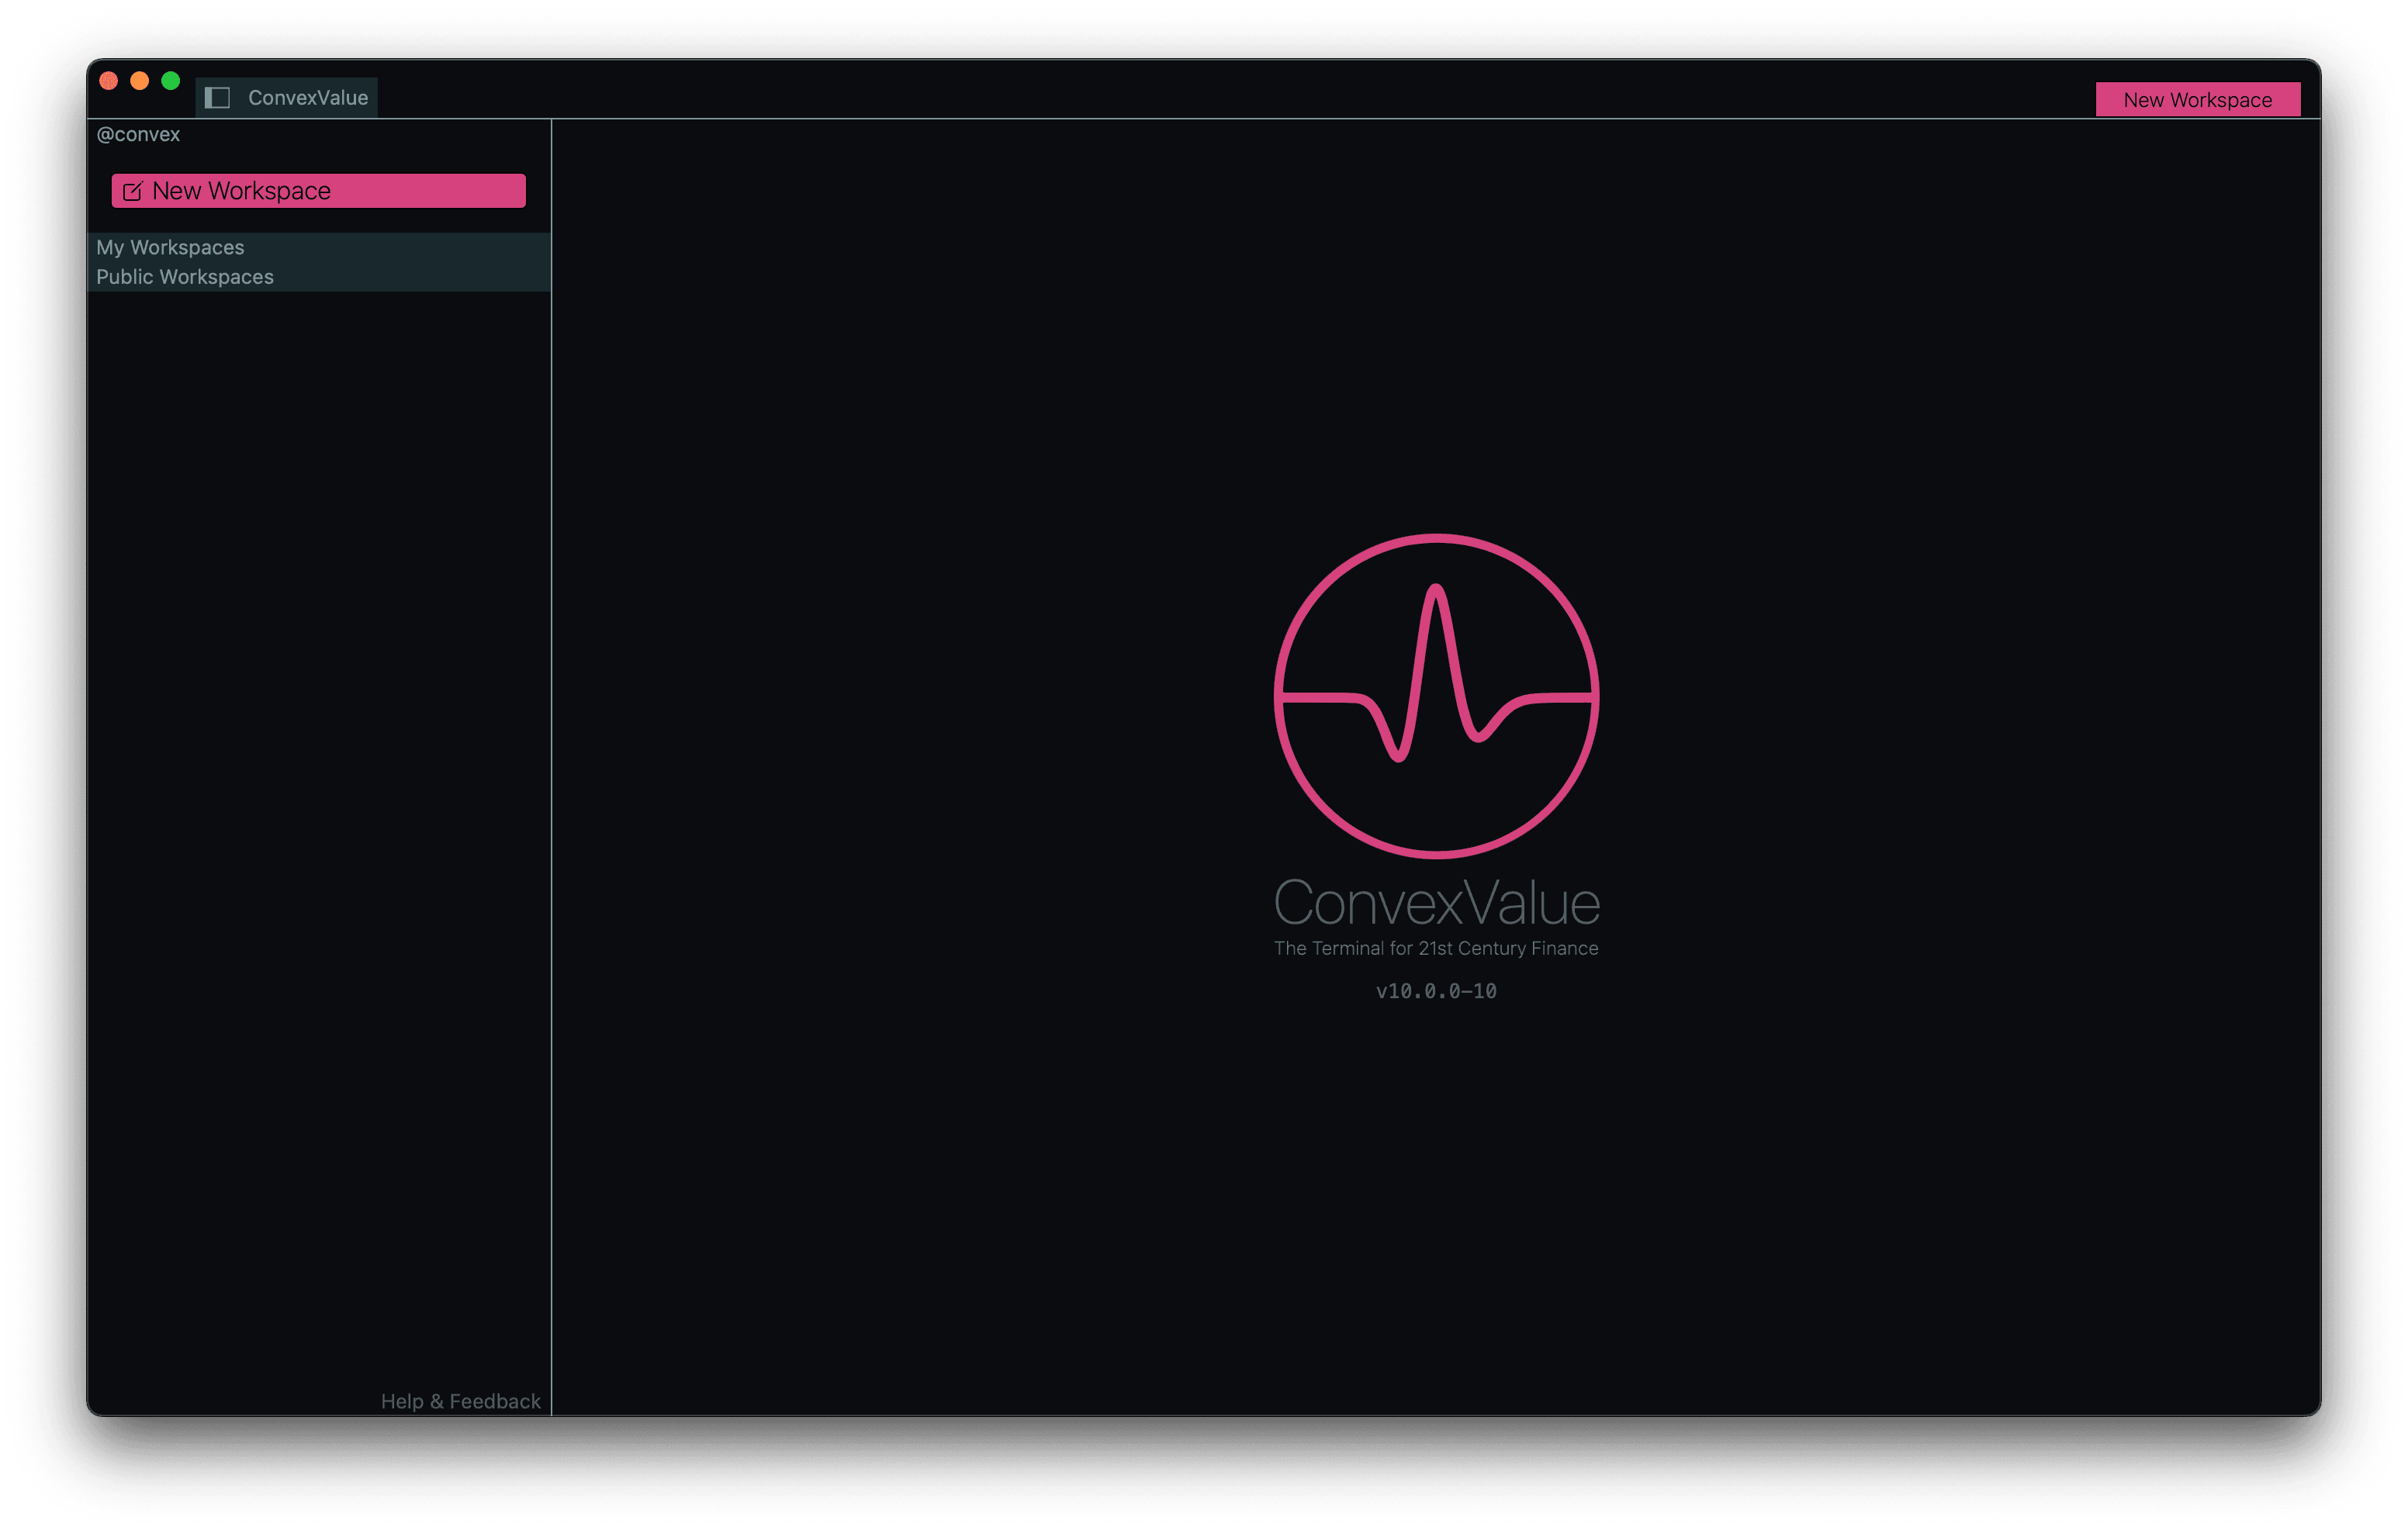
Note: Currently you may download both v6 (stable) and v10 (experimental). Both work exactly the same. Although certain cosmetic details are different, the functionality and tutorial here applies to both.
Let's break down the components of the product:
- Directory
- Tabs
- Main
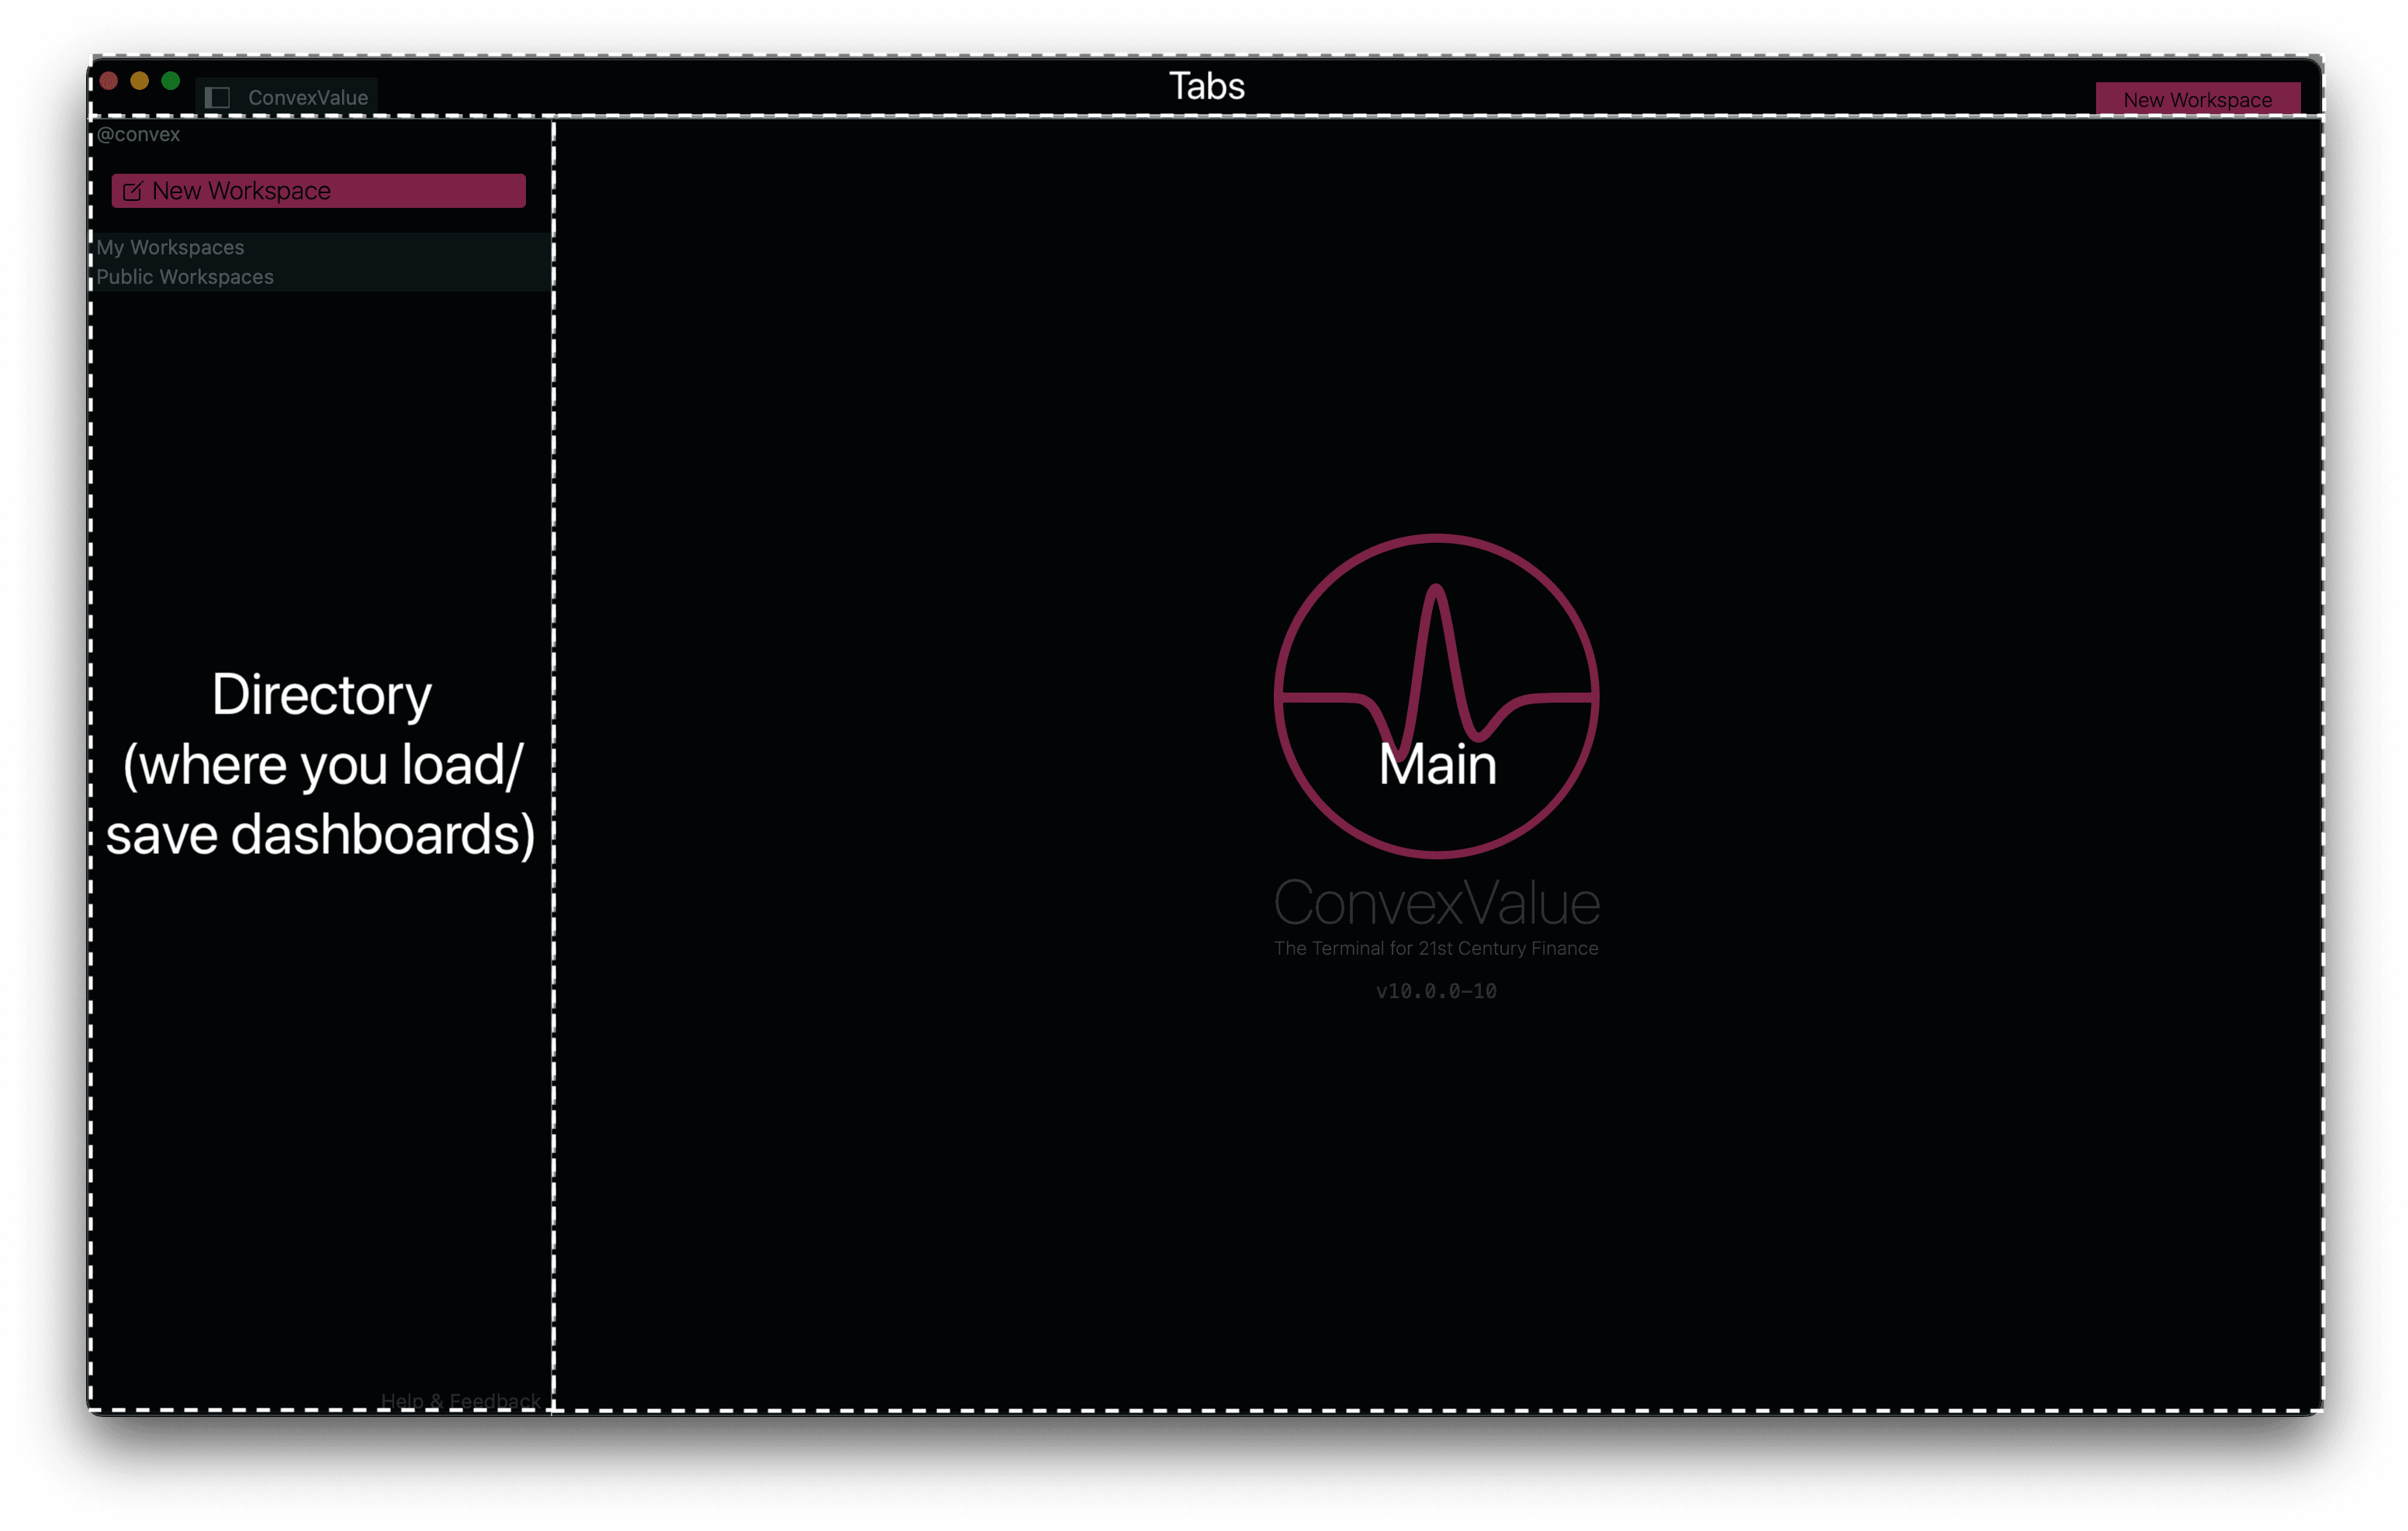
The Main area and the Tabs area should be familiar to you. All regular web-browsers have these two sections. The Main are is where you see your website, and the Tabs are what you use when you have many websites open.
In The ConvexValue Terminal they work the same: the Tabs section lets you toggle between different Main areas.
In ConvexValue lingo - your dashboard goes in the Main area, the Tabs let you toggle between many active dashboards, and the Directory is where you store all your saved dashboards and clone dashboards from others.
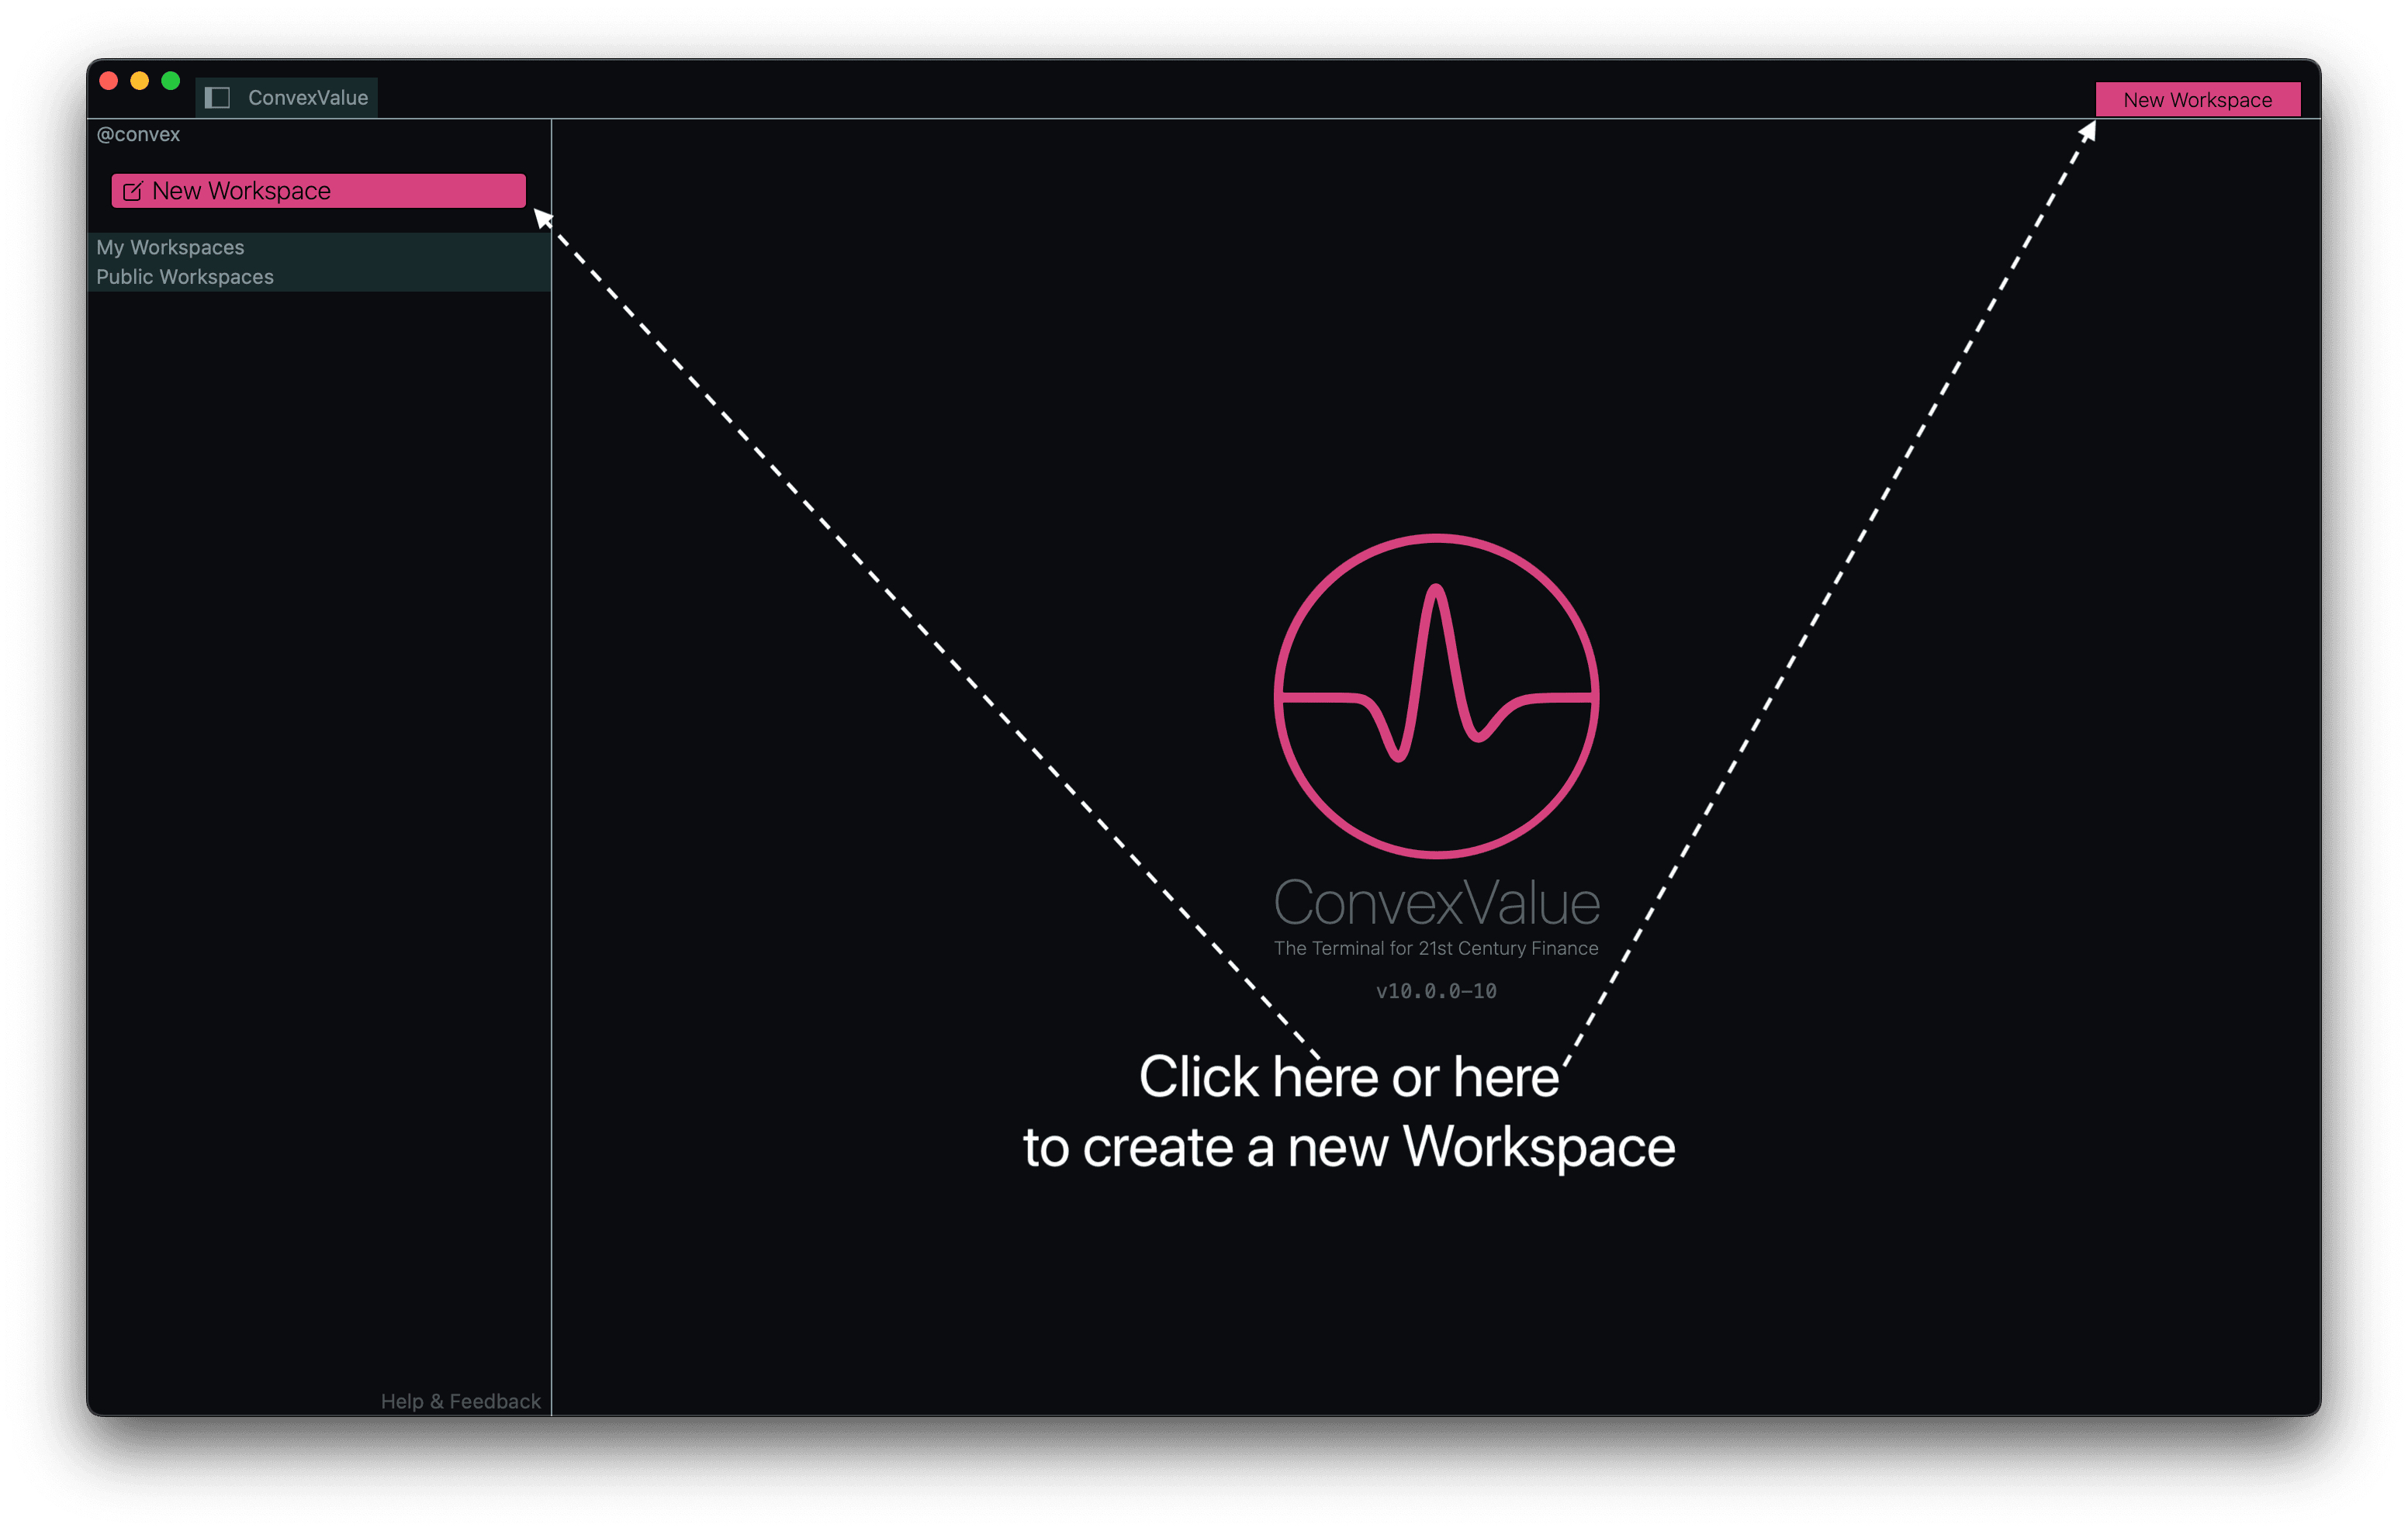
Creating a Dashboard
To Create a dashboard you click on the "New Workspace" button. A Workspace contains a collection of dashboards - like a folder of dashboards. This lets you organize dashboards into themes, trades, ideas, etc.
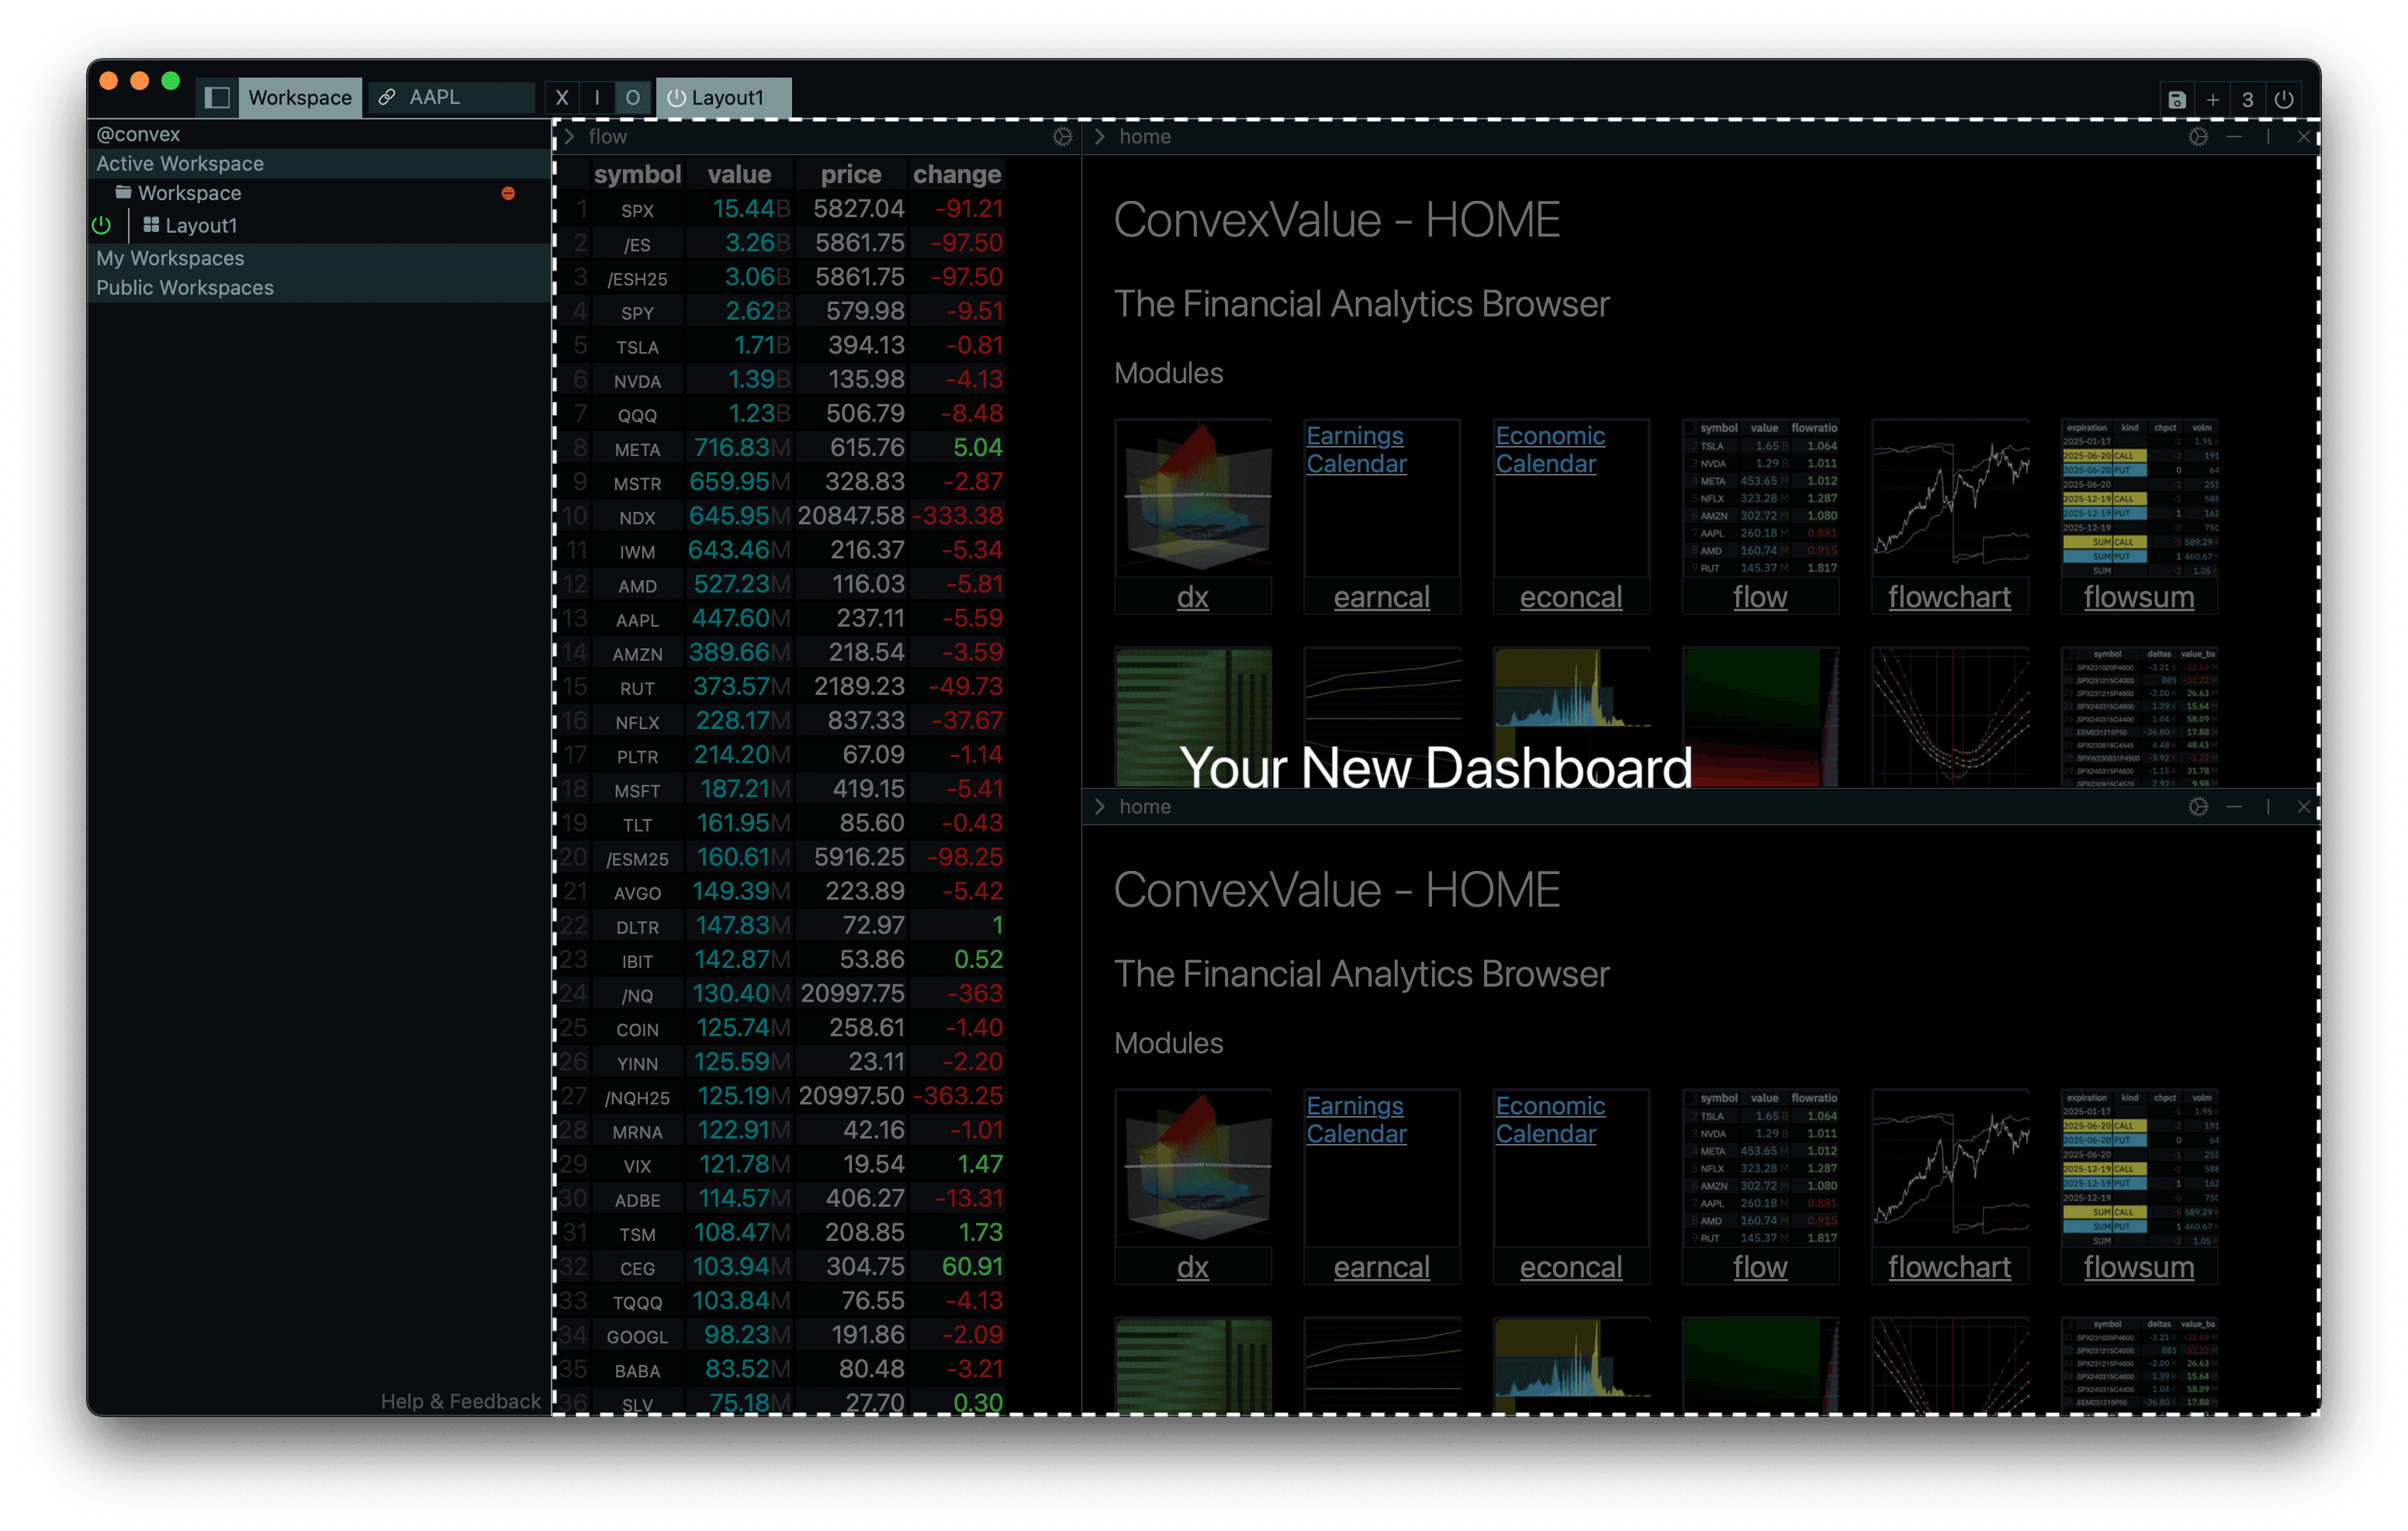
Once you click that button it should look something like this:
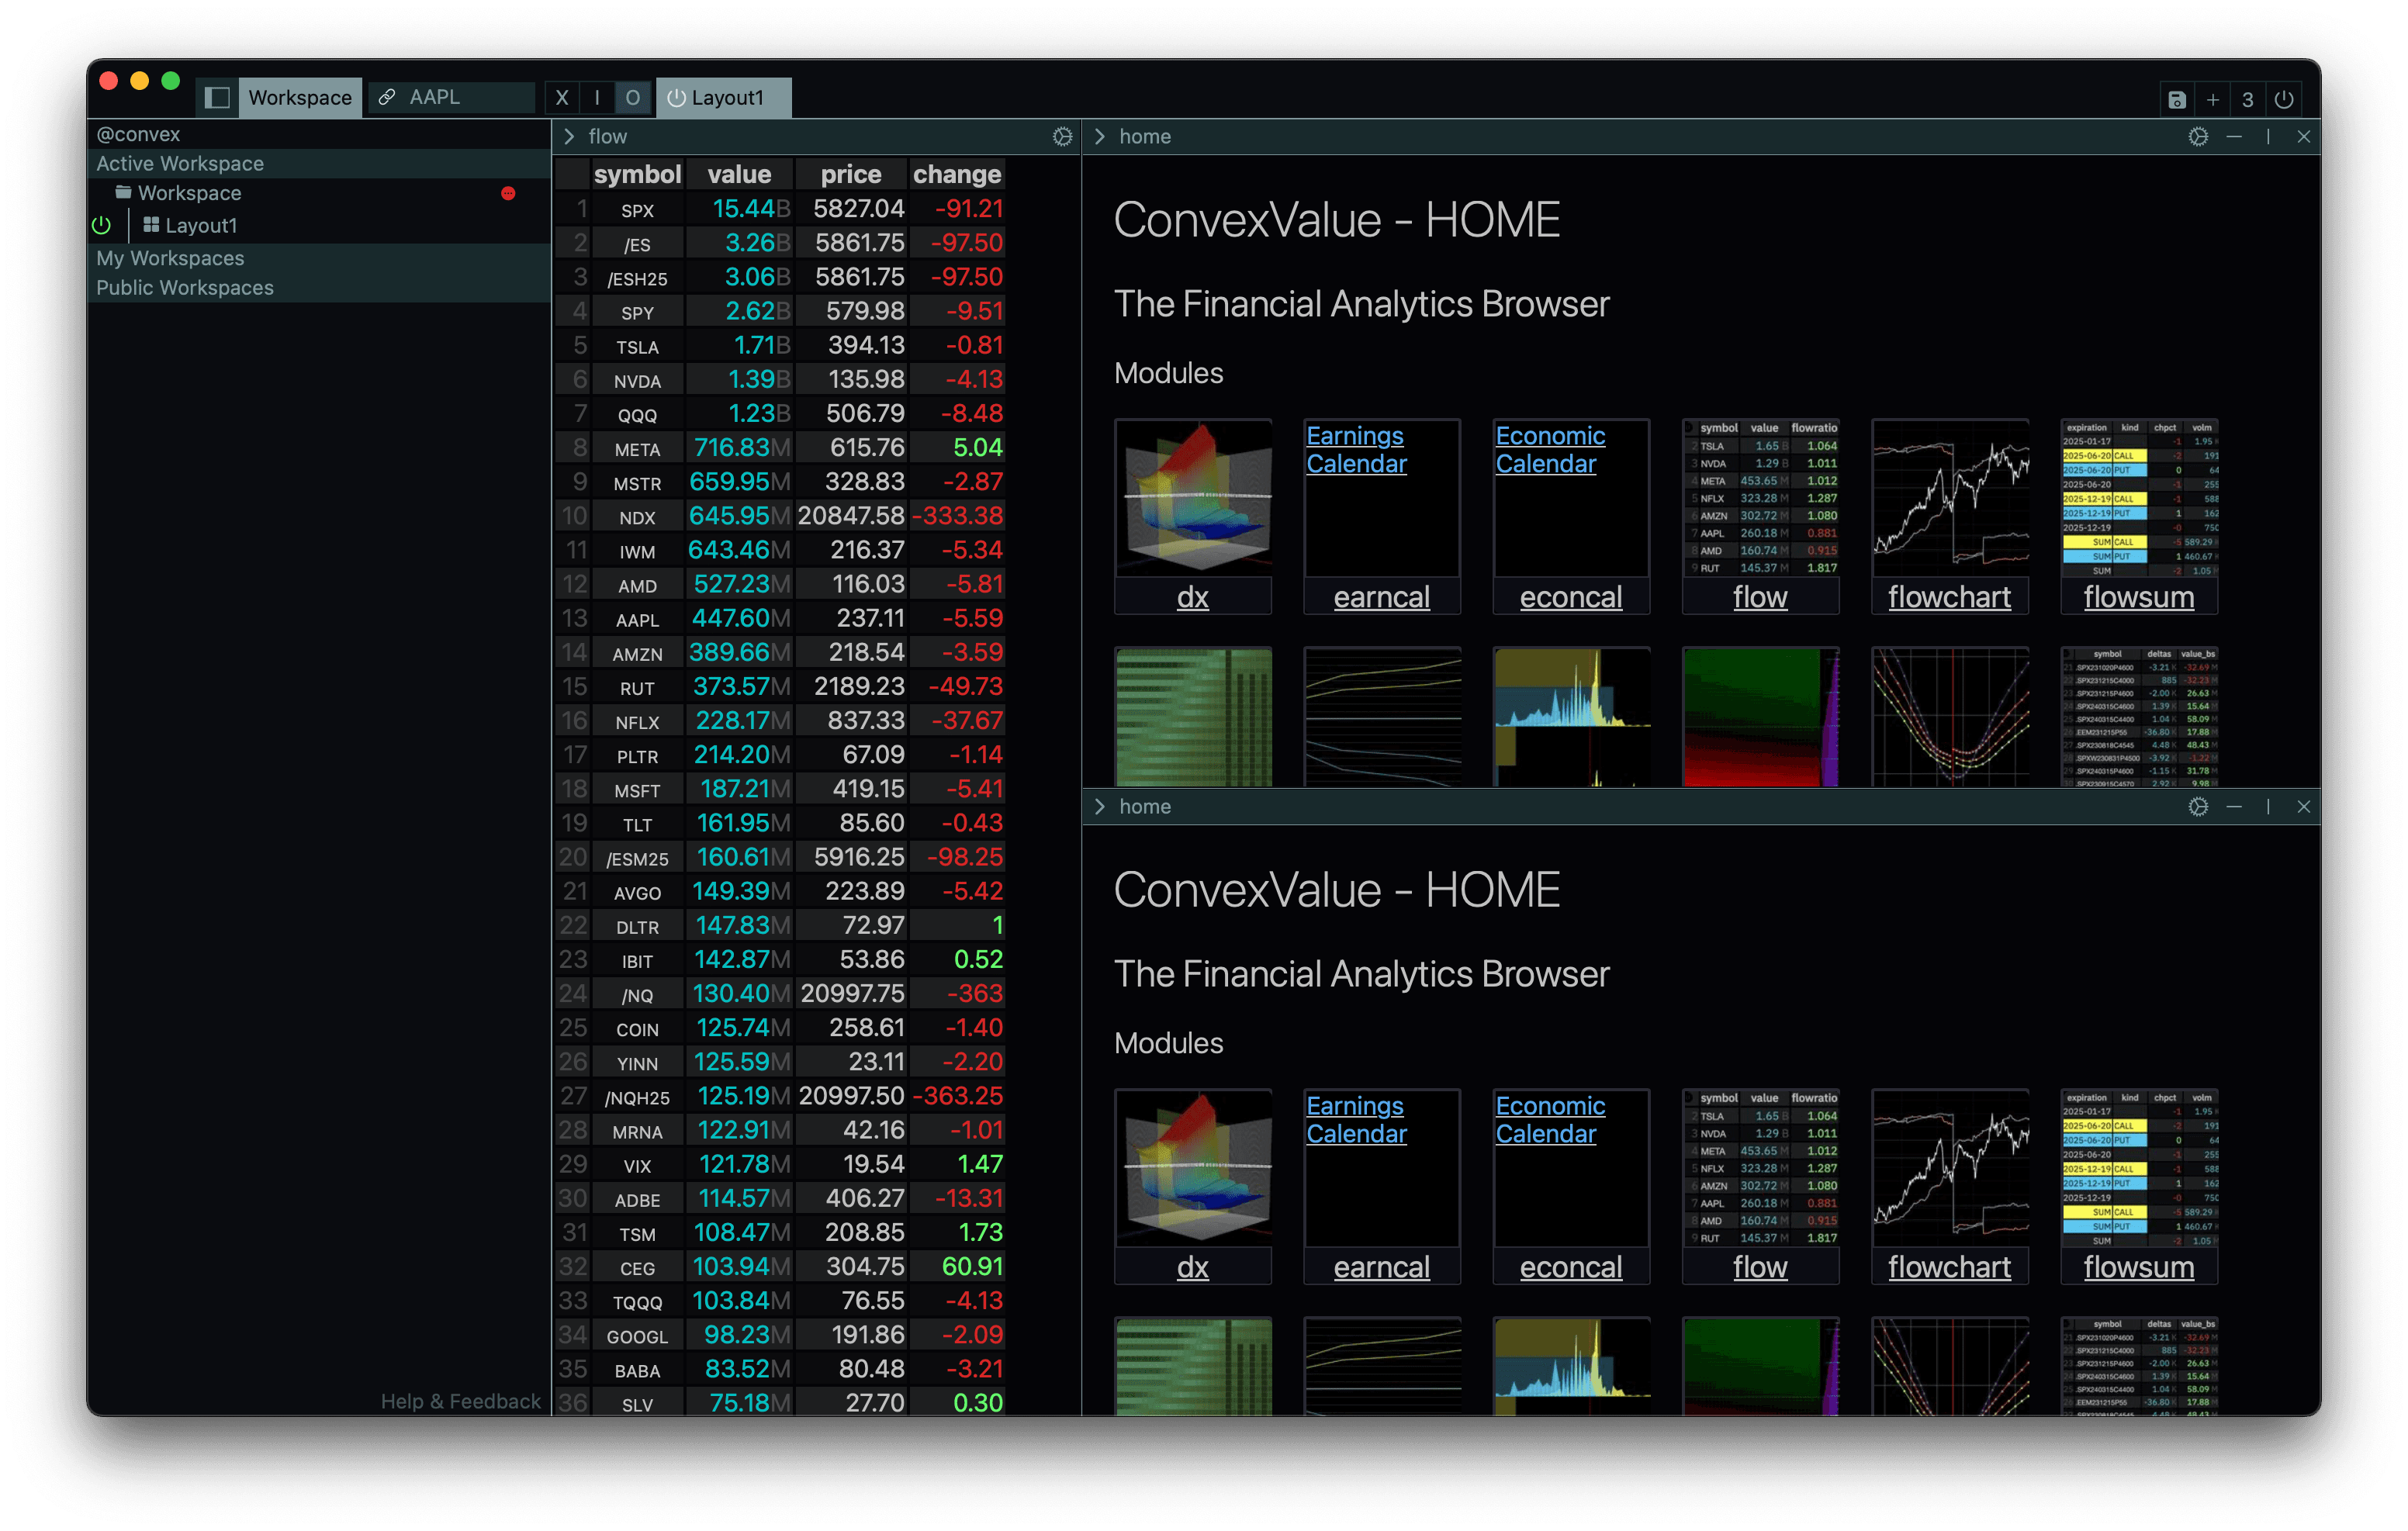
Let's see what happened on each of the components:
- Main: it was previously empty, but it now has something there. This something is the dashboard.
- Tabs: it was previously empty, but now there is a tab named "Layout1" which is highlighted. This is just like when you open a new tab on your web-browser.
- Directory: it was previously empty, but now on the top under the section "Active Workspace" there is a breakdown of the Workspace and Dashboard you currently have open.
You have now created your first dashboard! Up next: let's do something with it.
Split-Panes