Apps · Flow
flow: options flow scanner
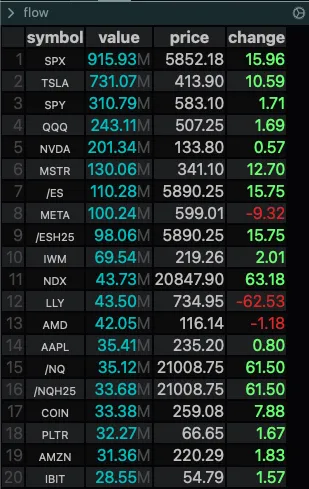
flow is the ConvexValue Terminal app that ranks stocks by their options activity. It is a live table with one row per underlying, ordered by the column you choose: premium traded, call buying, put buying, or any other of 100+ columns.
How to use flow
flow [param=value ...]
flow takes no symbol: it scans the whole market. Type the command in the command bar of a pane, or set the same parameters in the control panel (the ⚙️ at the right of the bar). In a browser, the app opens at convexvalue.com/go/flow/.
Parameters
| Parameter | Values | Default | What it does |
|---|---|---|---|
cols |
Underlying parameters, separated by commas | value,price,change |
The columns of the table, after the symbol. |
orderby |
One underlying parameter | value |
The column that ranks the rows. |
limit |
A whole number | 50 |
How many rows to show. |
asc |
t or f |
f |
asc puts the smallest value first. Without it the largest is first. |
filters |
Conditions, separated by commas: column>number, column<number, column=number |
none | Keeps the rows that meet every condition. |
s |
Symbols, separated by commas | none | Rows that stay on top, whatever the order and the filters. |
The columns are the Underlying Parameters of the Data Parameters page. The control panel lists them too.
Examples
The default: stocks ranked by value, the options premium traded today, with the stock's price and change.
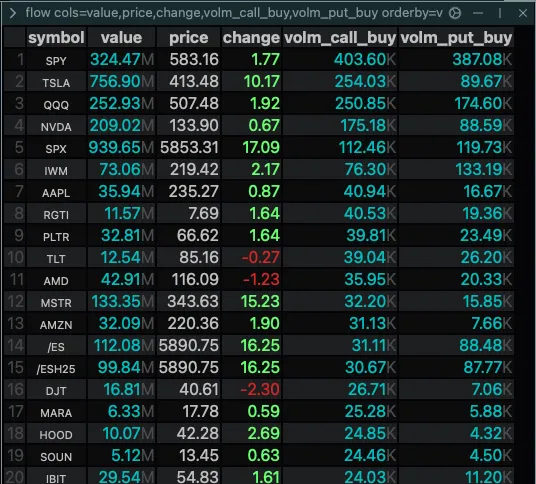
Ranked by the volume of calls bought, with the volume of puts bought next to it.
Ranked by vflowratio, among stocks with more than $1M of premium traded and more than 100 puts bought. The filters leave out the illiquid names that a ratio alone would put on top.
The default ranking, with AAPL, MSFT and NVDA kept in the first three rows.
The 20 highest put/call ratios, among underlyings with more than 50,000 options traded.
How to read it
- Each row is one underlying. The first column is its rank, the second its symbol, then your columns in the order of
cols. valueis premium: the dollars paid for the options traded today on that underlying.volmis the number of contracts.- A column ending in
_buyor_sellcounts the trades where the buyer or the seller was the aggressor.volm_call_buyis the volume of calls bought,value_put_sellthe premium of puts sold. flowratiois (premium of call buys + put sells) / (premium of put buys + call sells).vflowratiois the same with volume. Above 1, the first group is larger; below 1, the second.- The cells update as trades arrive. The ranking itself is drawn again every 10 seconds, so a row can move.
- In the desktop app, a click on a symbol sets it as the global symbol.