Apps · Expectations
ip: implied probabilities
ip is the ConvexValue Terminal app that turns option prices into ranges. For each expiration of a symbol it shows the forward price, the range where the options imply a 50% chance of closing, the 70% range, and the price of the straddle.
How to use ip
ip SYMBOL [param=value ...]
The symbol is required. Type the command in the command bar of a pane, or set the same parameters in the control panel (the ⚙️ at the right of the bar). In a browser, the app opens at convexvalue.com/go/ip/.
Parameters
| Parameter | Values | Default | What it does |
|---|---|---|---|
SYMBOL |
An underlying symbol, or @ |
required | The underlying. @ is the global symbol. |
exp |
Numbers, ranges or both: 1, 1-5, 1-5,10 |
every expiration | Which expirations to show. 1 is the nearest. |
ht |
t or f |
f |
ht hides the labels above the chart. |
Examples
Every expiration of AAPL.
The five nearest expirations of SPX.
Three expirations, the chart alone: for a small pane.
The same view for whatever the global symbol is.
How to read it
The idea: the delta of an option is close to the probability that it expires in the money. A call with a delta of 0.25 has a strike that the options give about a 25% chance of being exceeded at expiration; a put with a delta of -0.25, a strike with about a 25% chance of not being reached. Between those two strikes lies half of the probability.
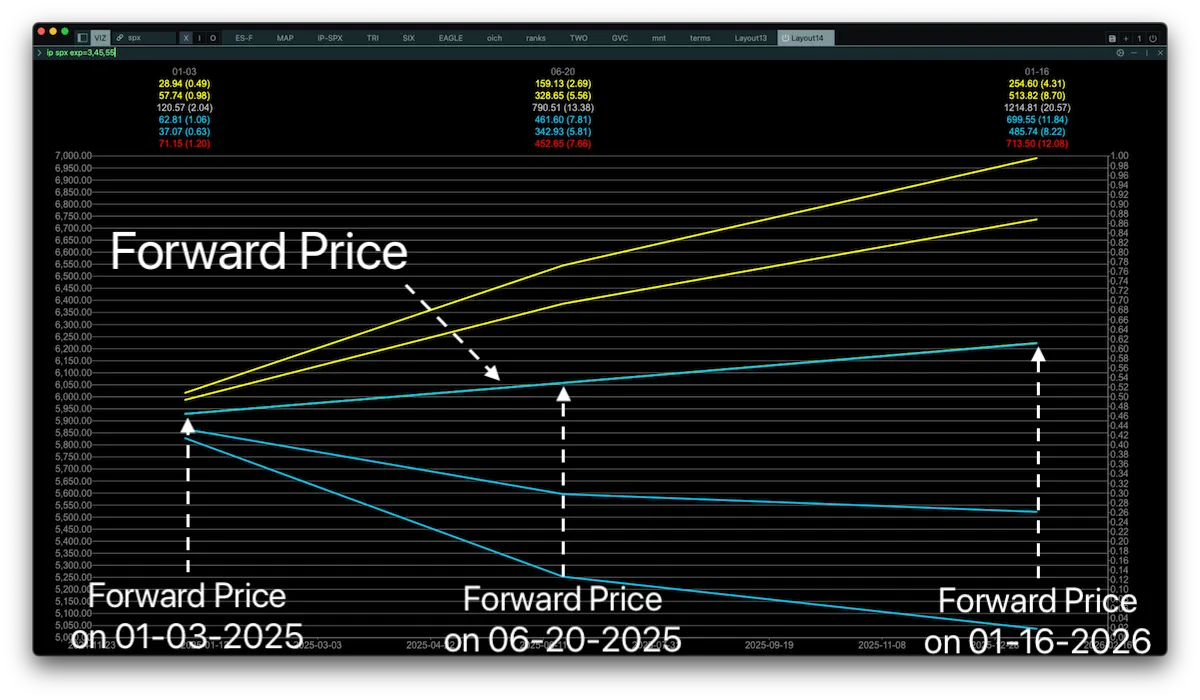
The forward price. For each expiration the app finds the strikes where delta is 0.5: the price the options treat as the middle. For near dates it is close to the current price; for far dates it differs, because of the cost of carry.
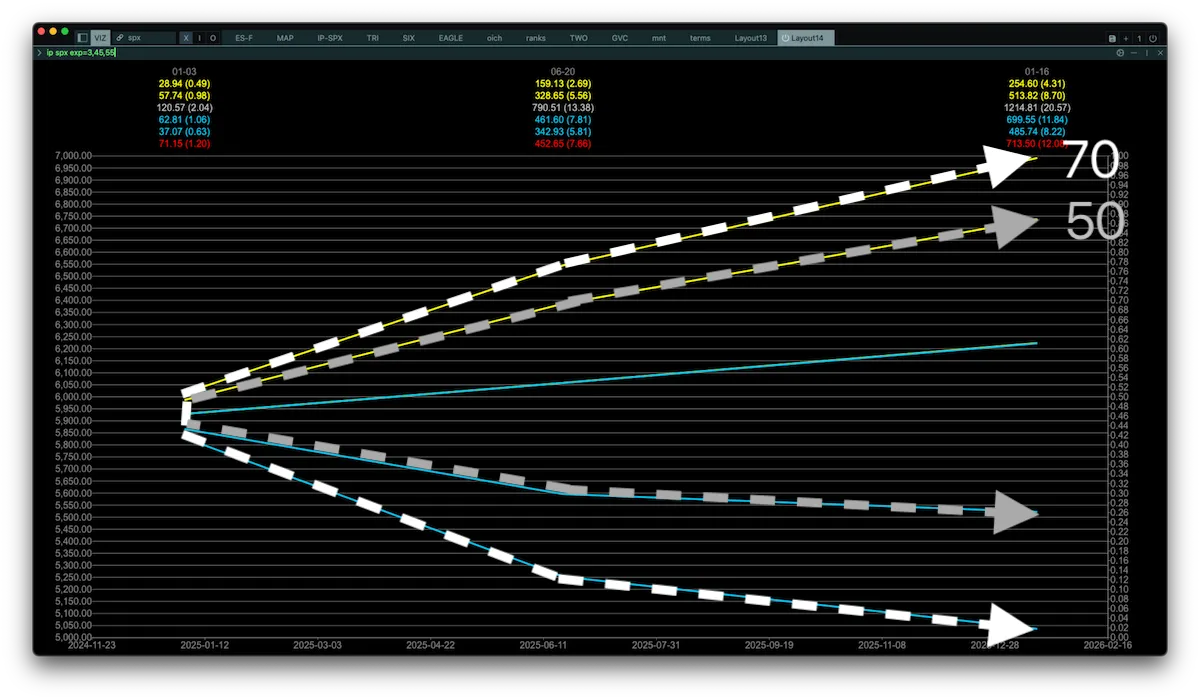
The ranges. Two cones open from today towards the later expirations: the 50% range (between the 25-delta put and the 25-delta call) and the 70% range (between the 15-delta put and the 15-delta call). The lower edge is blue because it comes from put prices, the upper edge yellow because it comes from call prices.
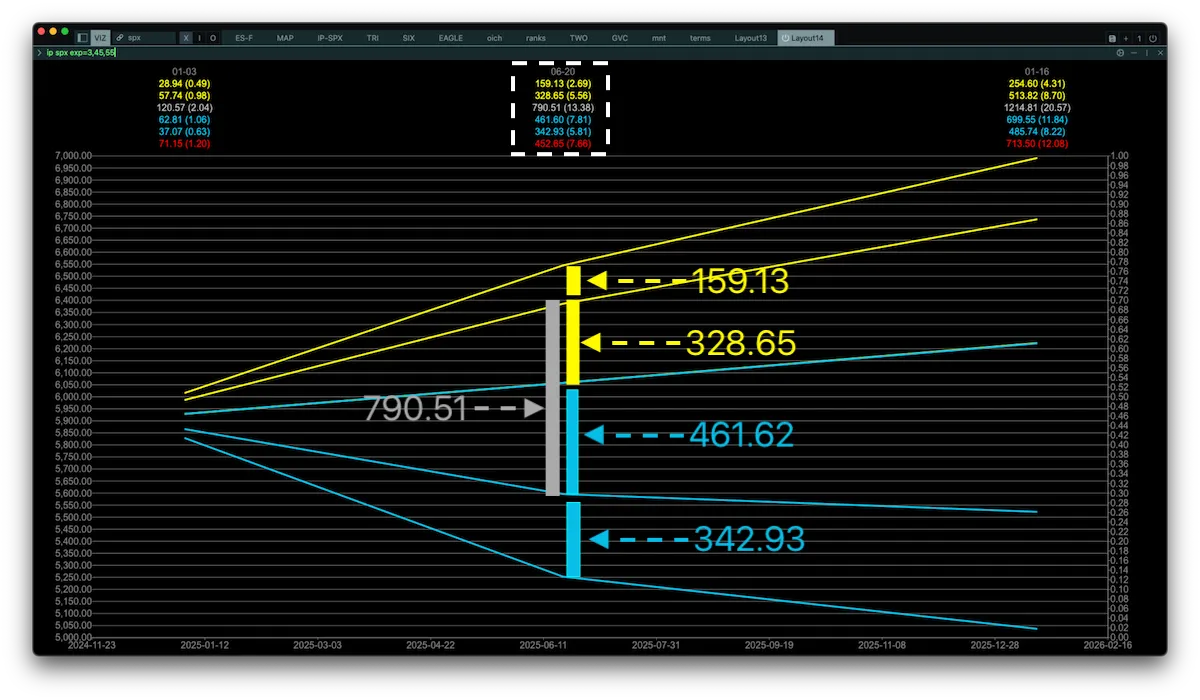
The labels. Above each expiration: its date, then six rows. Each row is a distance in points and, in brackets, the same distance as a percentage of the current price. From top to bottom:
- Yellow: from the top of the 50% range to the top of the 70% range.
- Yellow: from the forward price to the top of the 50% range.
- Grey: the whole 50% range.
- Blue: from the bottom of the 50% range to the forward price.
- Blue: from the bottom of the 70% range to the bottom of the 50% range.
- Red: the straddle, the at-the-money call plus the at-the-money put. It is a common measure of the move the options price in.
Comparing the yellow rows with the blue ones shows on which side of the forward price the options put more of each range.
These are the probabilities implied by option prices today. They change as the prices do, and they are not a forecast of ConvexValue.